Liquidity Crush
Executive Summary
- Liquidity continues to contract across on-chain and spot markets, with net capital inflows grinding to a halt, and exchange inflows slowing down.
- Open Interest across futures contracts has pulled back, suggesting a reduction in hedging and speculative activity. Alongside this, an unwind in the cash-and-carry trade on CME Group futures appears to be underway, providing additional headwinds for market liquidity.
- Key options metrics express a preference for downside risk aversion, with the implied volatility priced into put options resulting in elevated premiums.
- Short-term investors are experiencing significant pressure to lock in losses. However, the incentive to capitulate remains somewhat less severe than in previous correction events and bearish periods.
- Long-Term Holder activity remains largely subdued, with a notable decline in their sell-side pressure. This cohort still owns a comparatively large volume of network wealth for this stage of the cycle, creating an interesting dynamic moving forward.
Contracting Liquidity
The digital asset landscape has experienced strong downside pressure over recent weeks, with the Bitcoin price falling from $97k in late February, to $82k today.
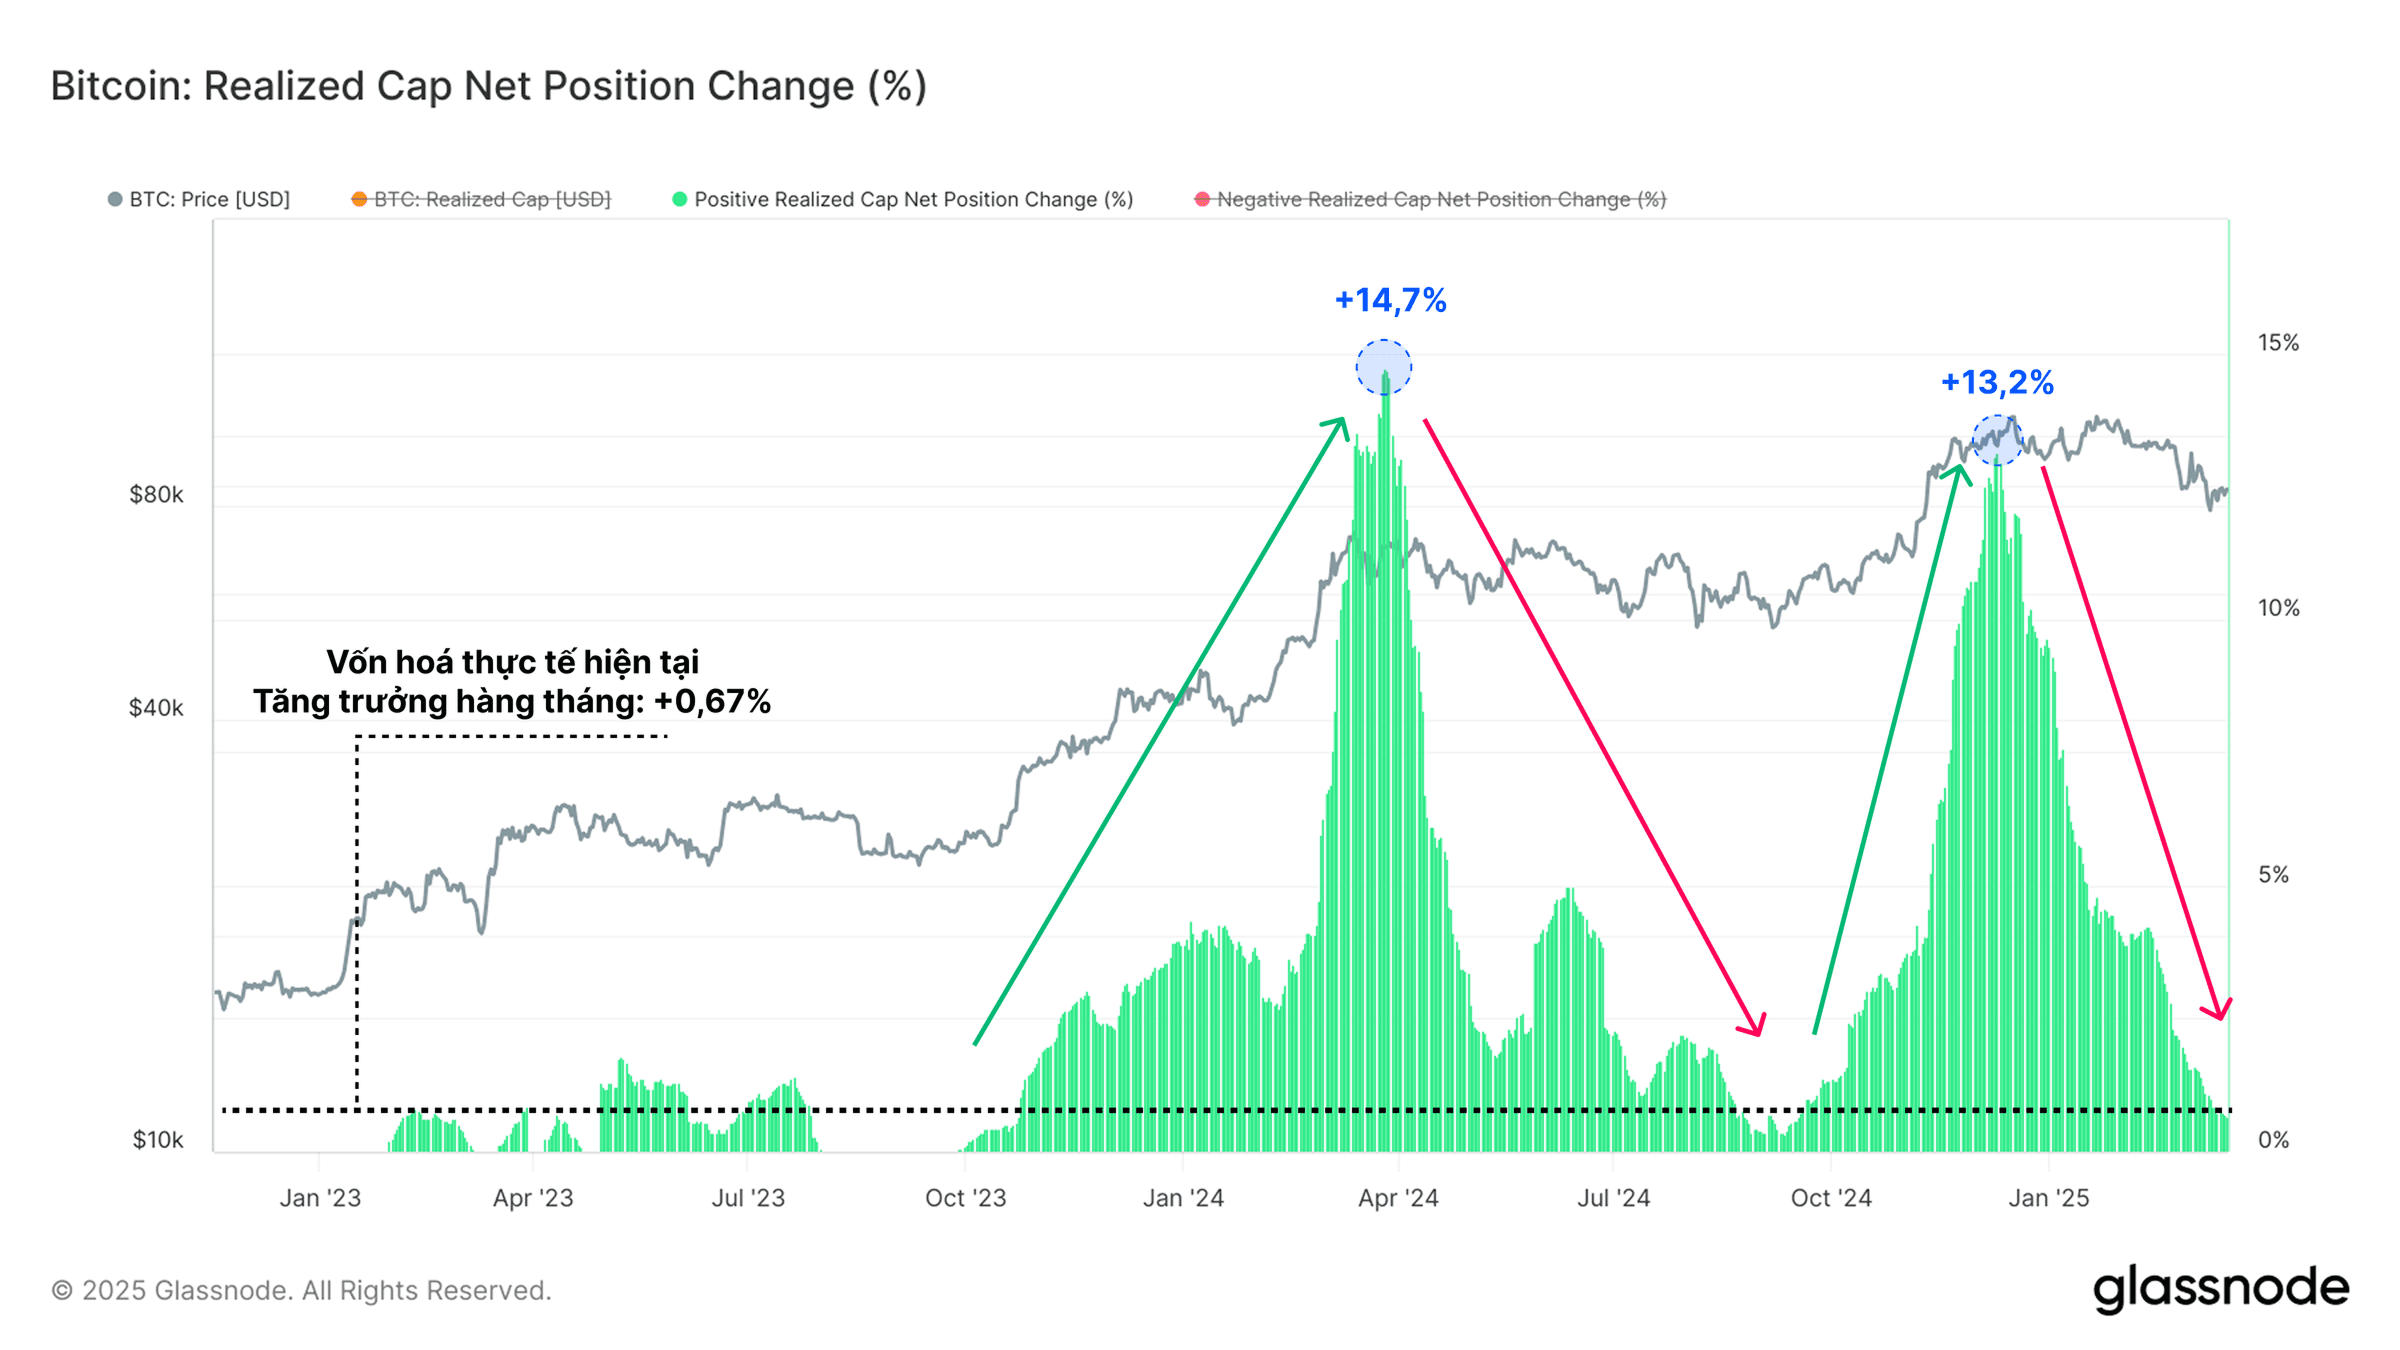
A stark contraction in liquidity appears to be underway, and supports the decline in valuations. Net capital inflows into Bitcoin are grinding to a halt, with the Realized Cap growing at a rate of only +0.67% per month.
From this, we can draw two key observations:
- As of now, there is a lack of fresh capital entering the asset to support higher prices.
- Volatility expectations are elevated, as the market transitions from a profit-dominated regime, back towards a more neutral equilibrium position.
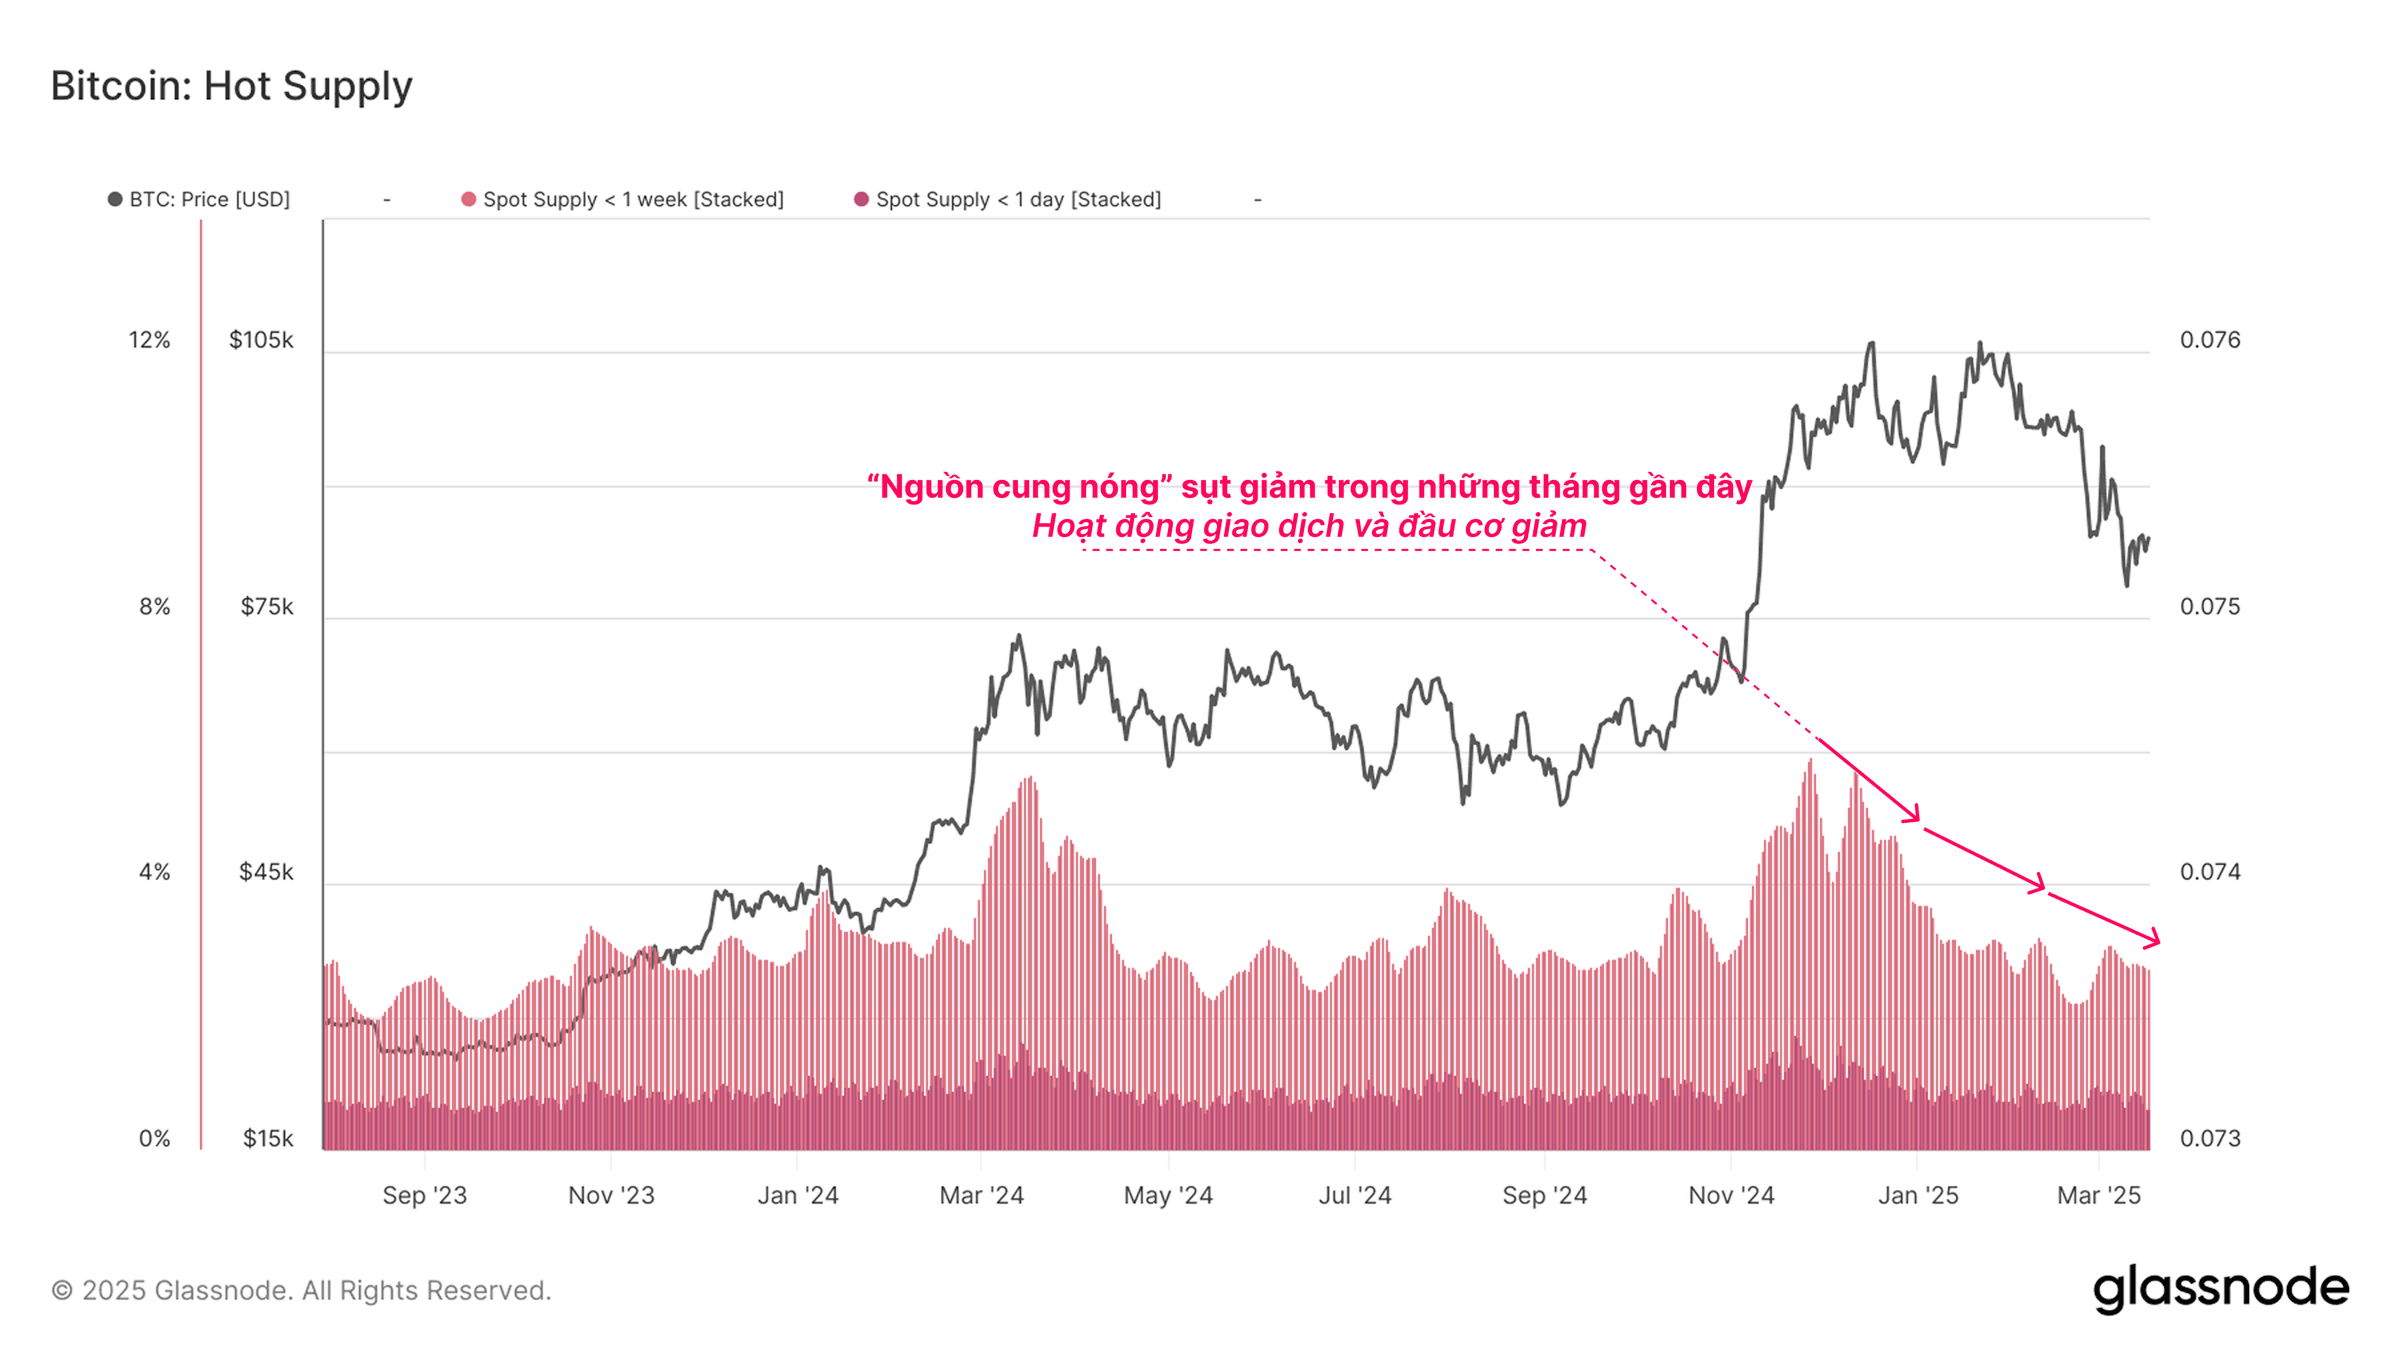
One method to measure and quantify active capital in the market is through the ‘Hot Supply’ metric. This supply volume represents the wealth held within coins aged one week or less and can be considered as a proxy for coins available and ready to transact.
The current wealth held by the Hot Supply cohort has declined from 5.9% of the circulating supply, to a value of just 2.8%. This represents more than a 50% contraction in liquid circulating coins, suggesting that there has been a decline in the appetite for trade and speculation.
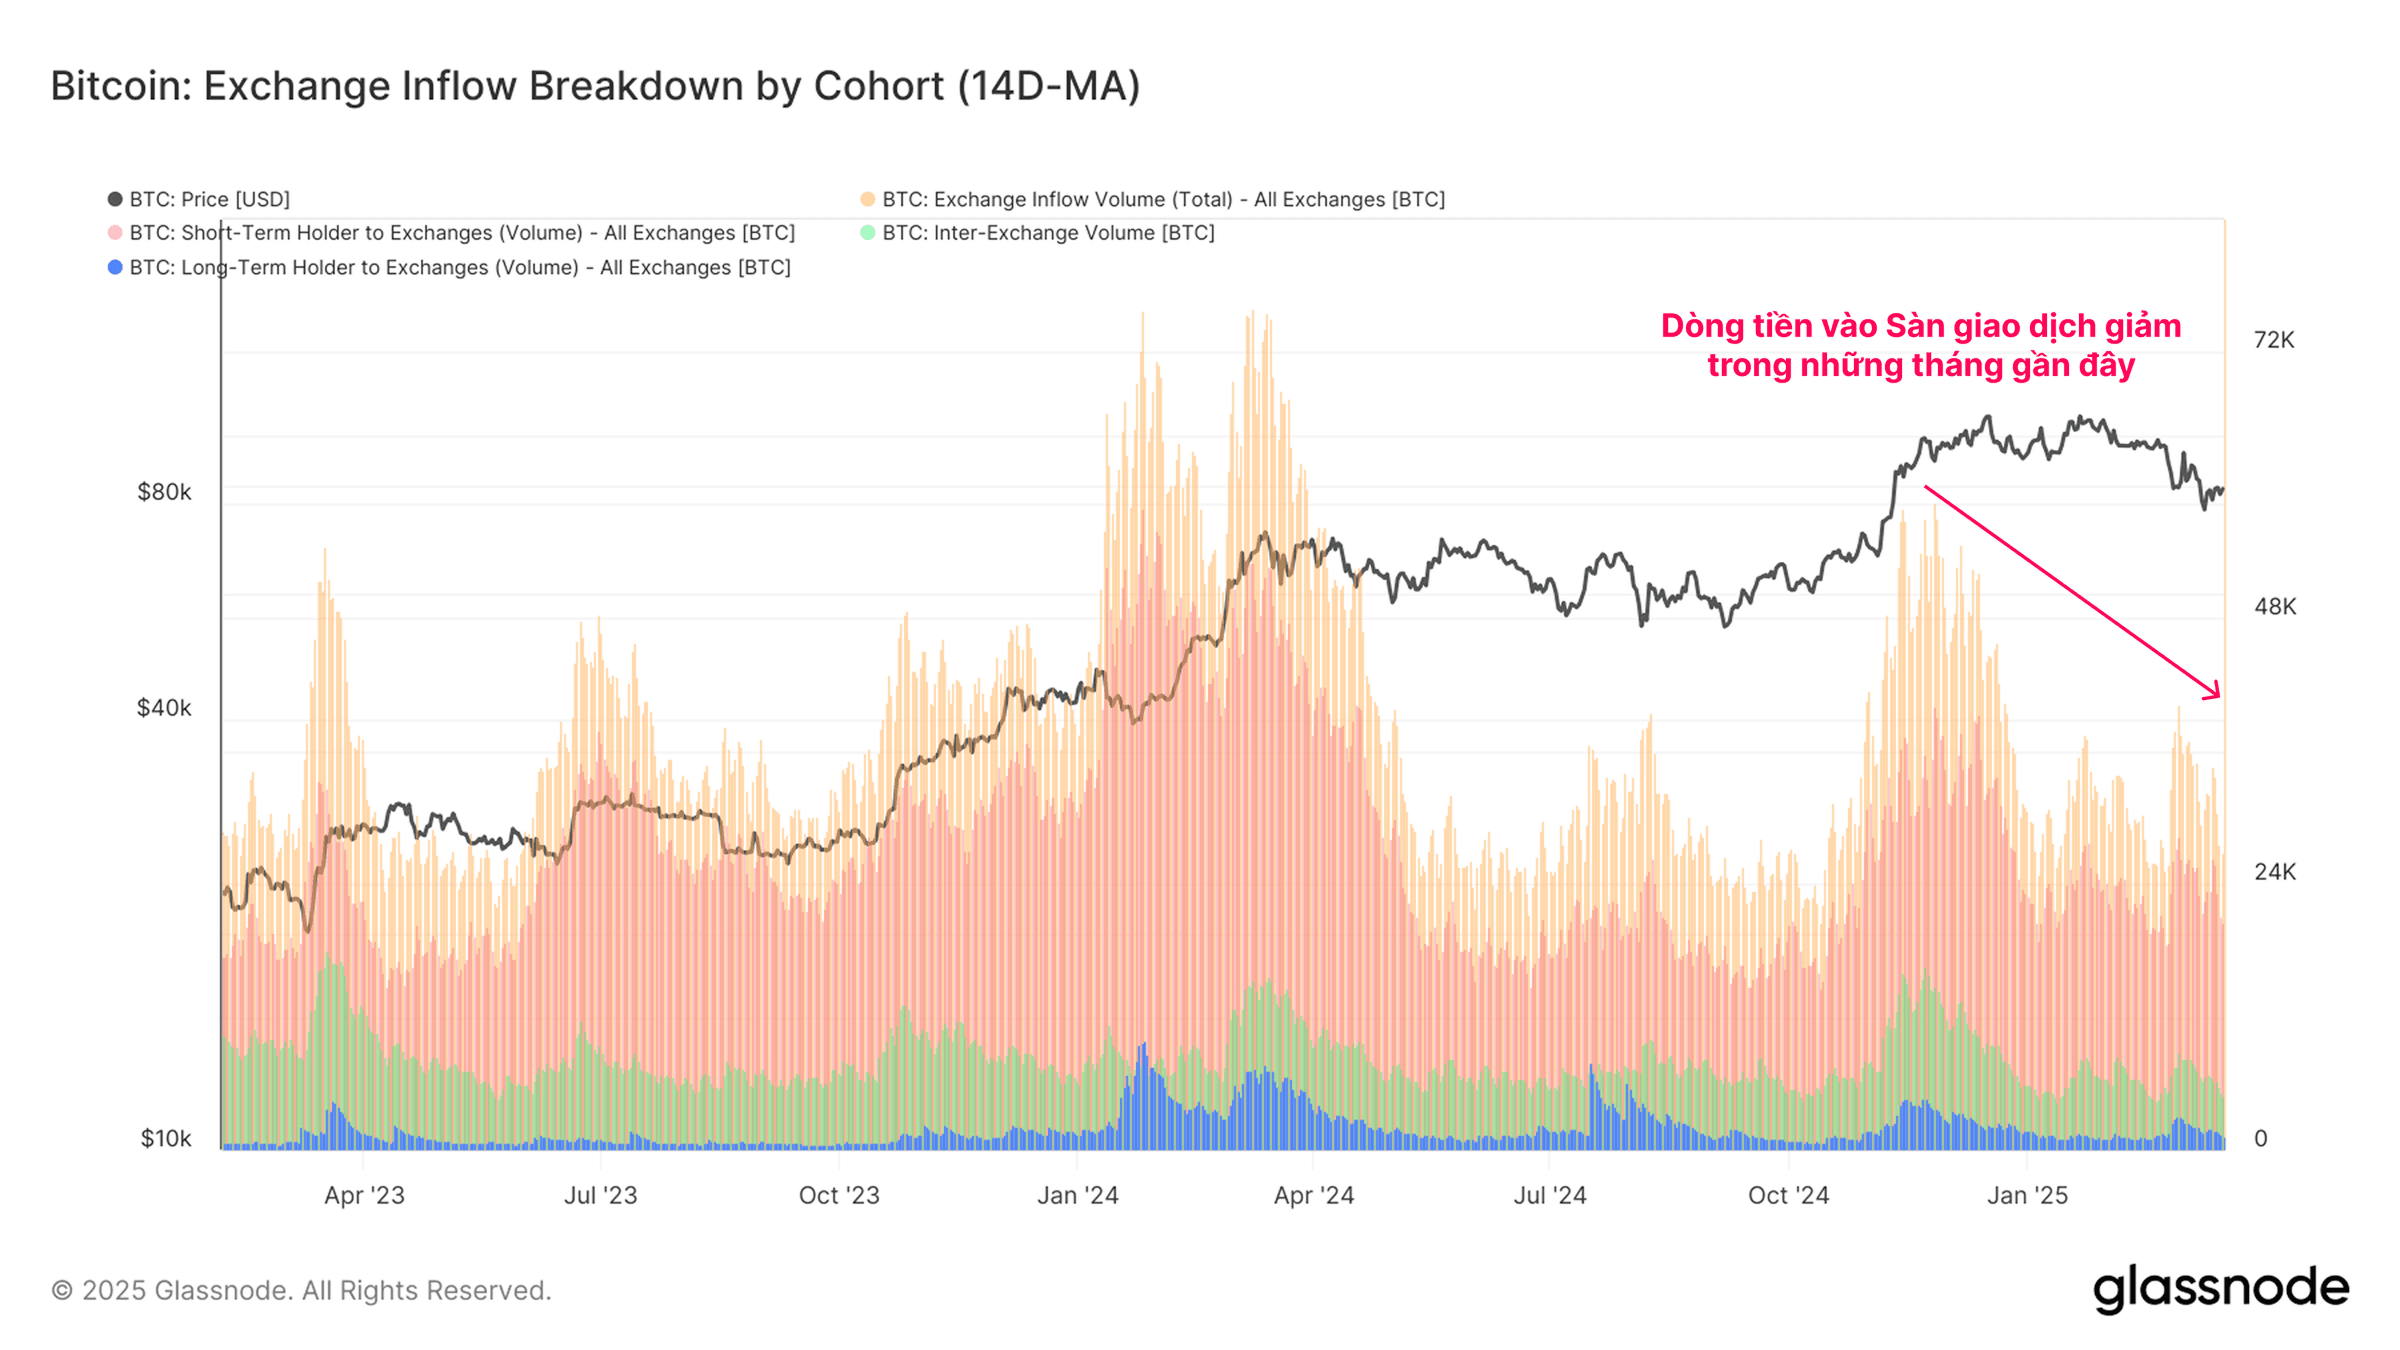
A similar trend can be seen across inflow volumes to Exchanges, the central locations for trading activity. Inflows across all exchanges have declined from +58.6k BTC/day at the market peak to the current value of +26.9k BTC/day, a decline of over -54%. This aligns with the decline in aggregate investor sentiment and market capital flows noted previously.
There is also a similarity in the magnitude of contraction between the Hot Supply, and Exchange Inflows, providing a view of weaker overall demand-side pressure.
Cash-and-Carry Unwind
Having assessed the on-chain landscape, we shall redirect our attention to the derivatives market, which experiences the highest trade volume of all market sectors.
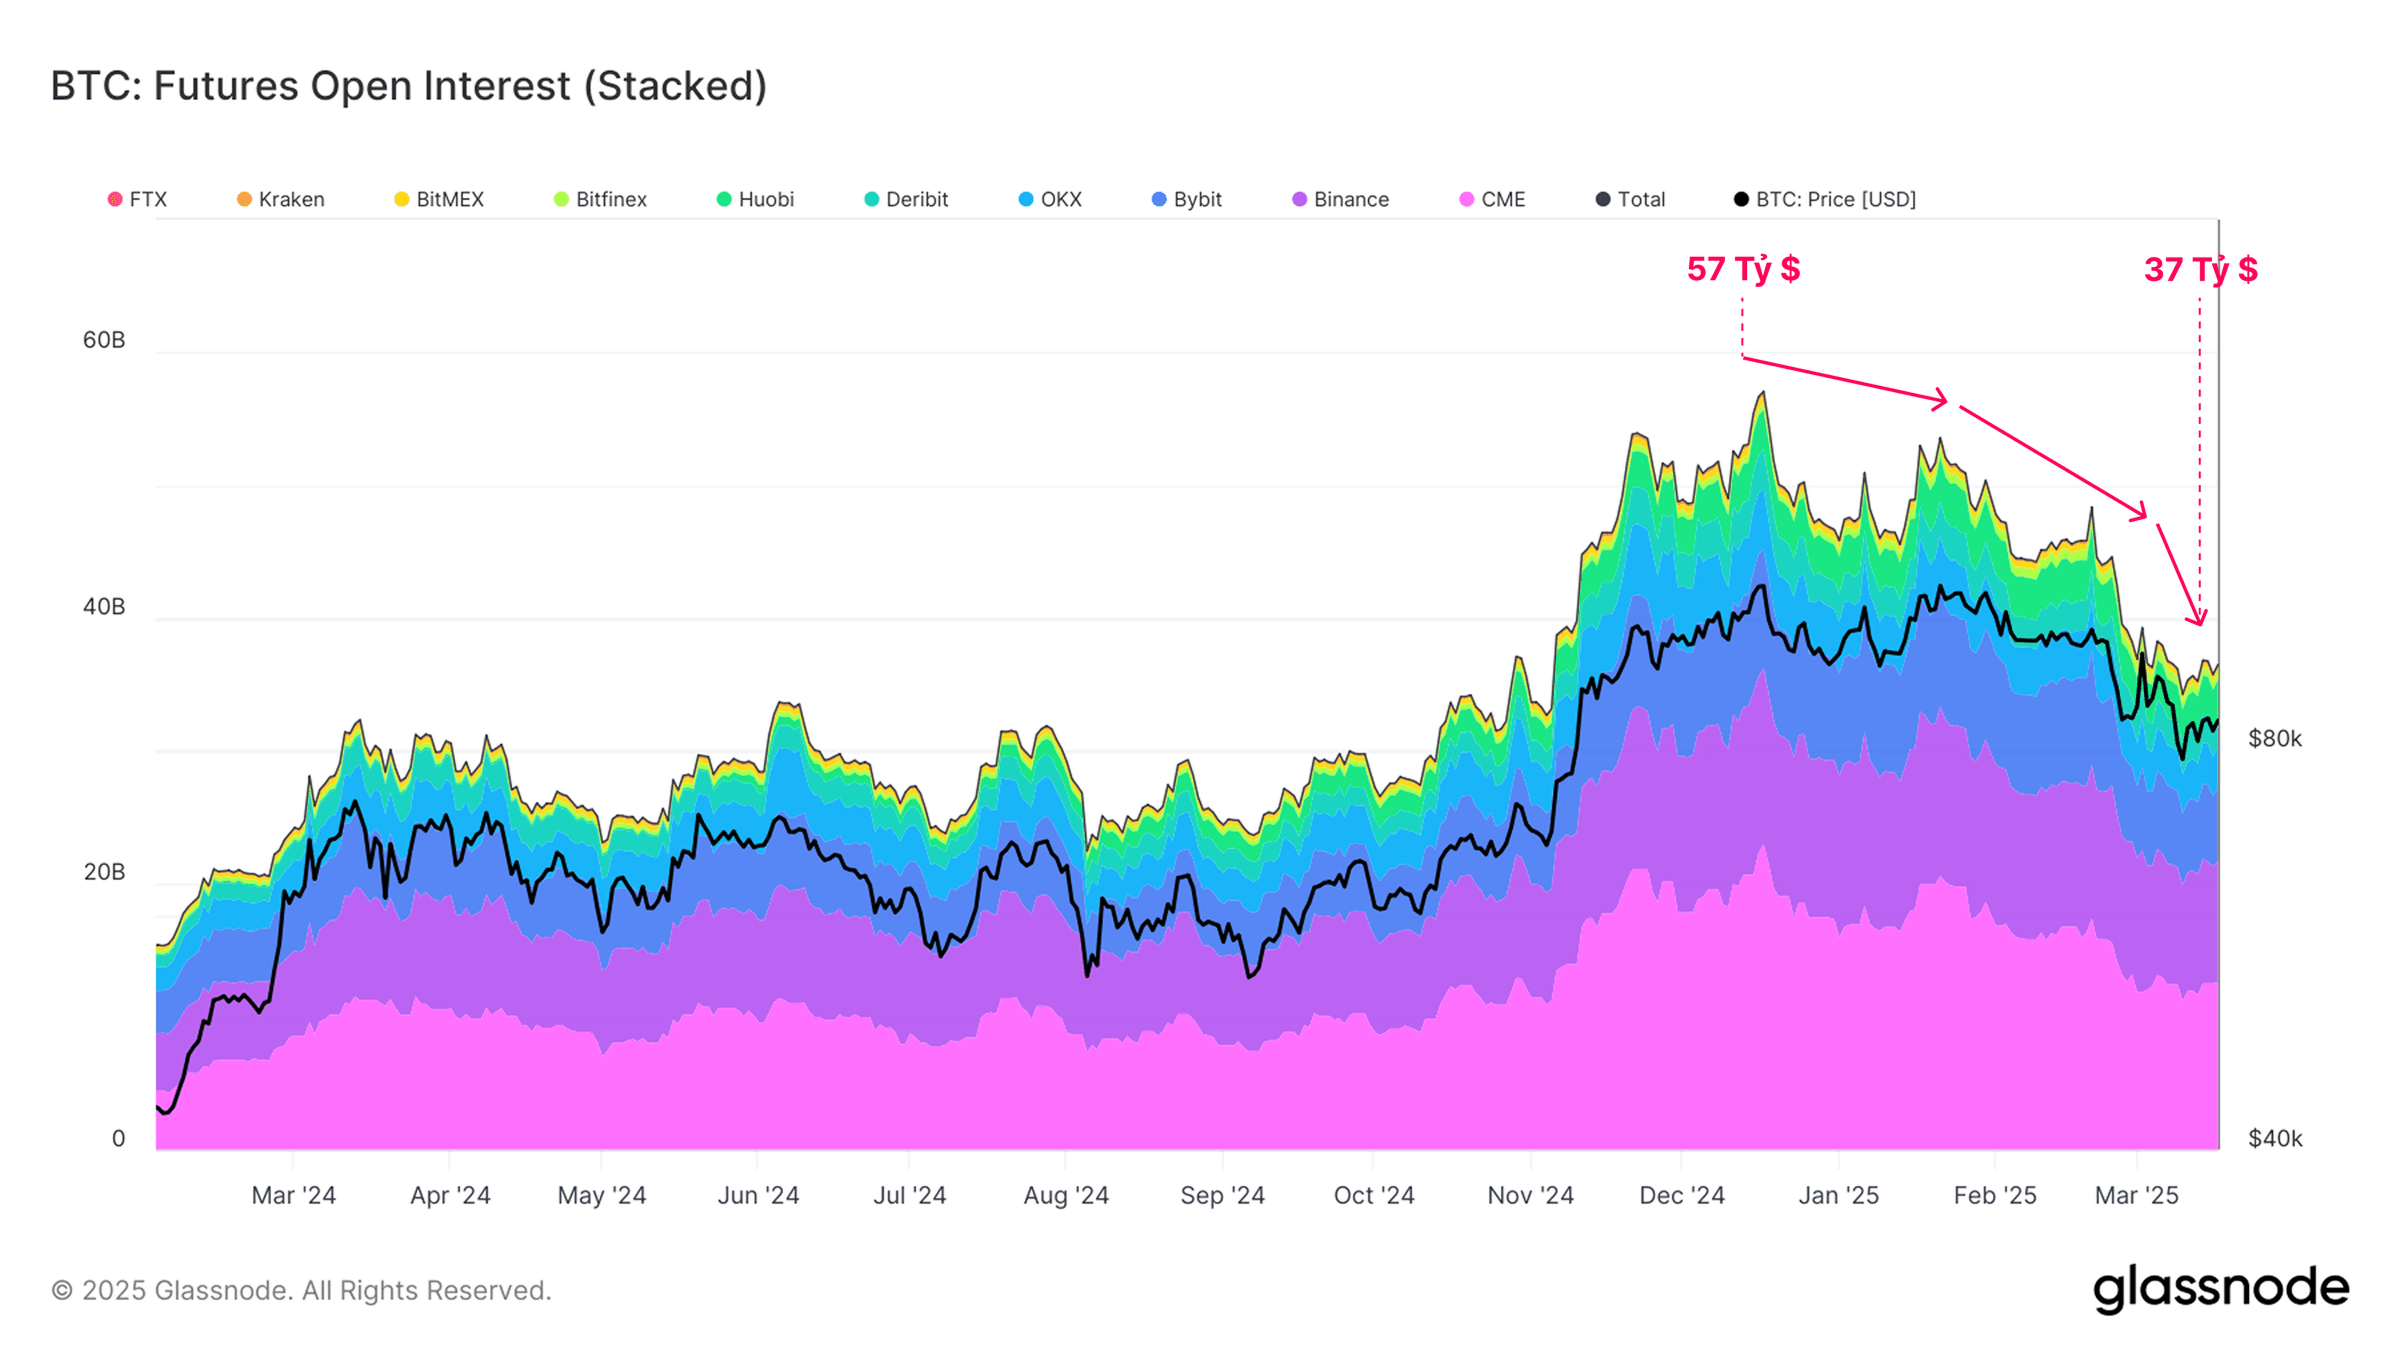
Assessing the open interest in futures contracts, we can see a large decline taking place in recent months. Open interest has declined from $57B at the market ATH, down to a current value of $37B (-35%).
This highlights a net reduction in speculation and hedging activity, painting a similar dynamic to the dampened activity witnessed in various on-chain markets.
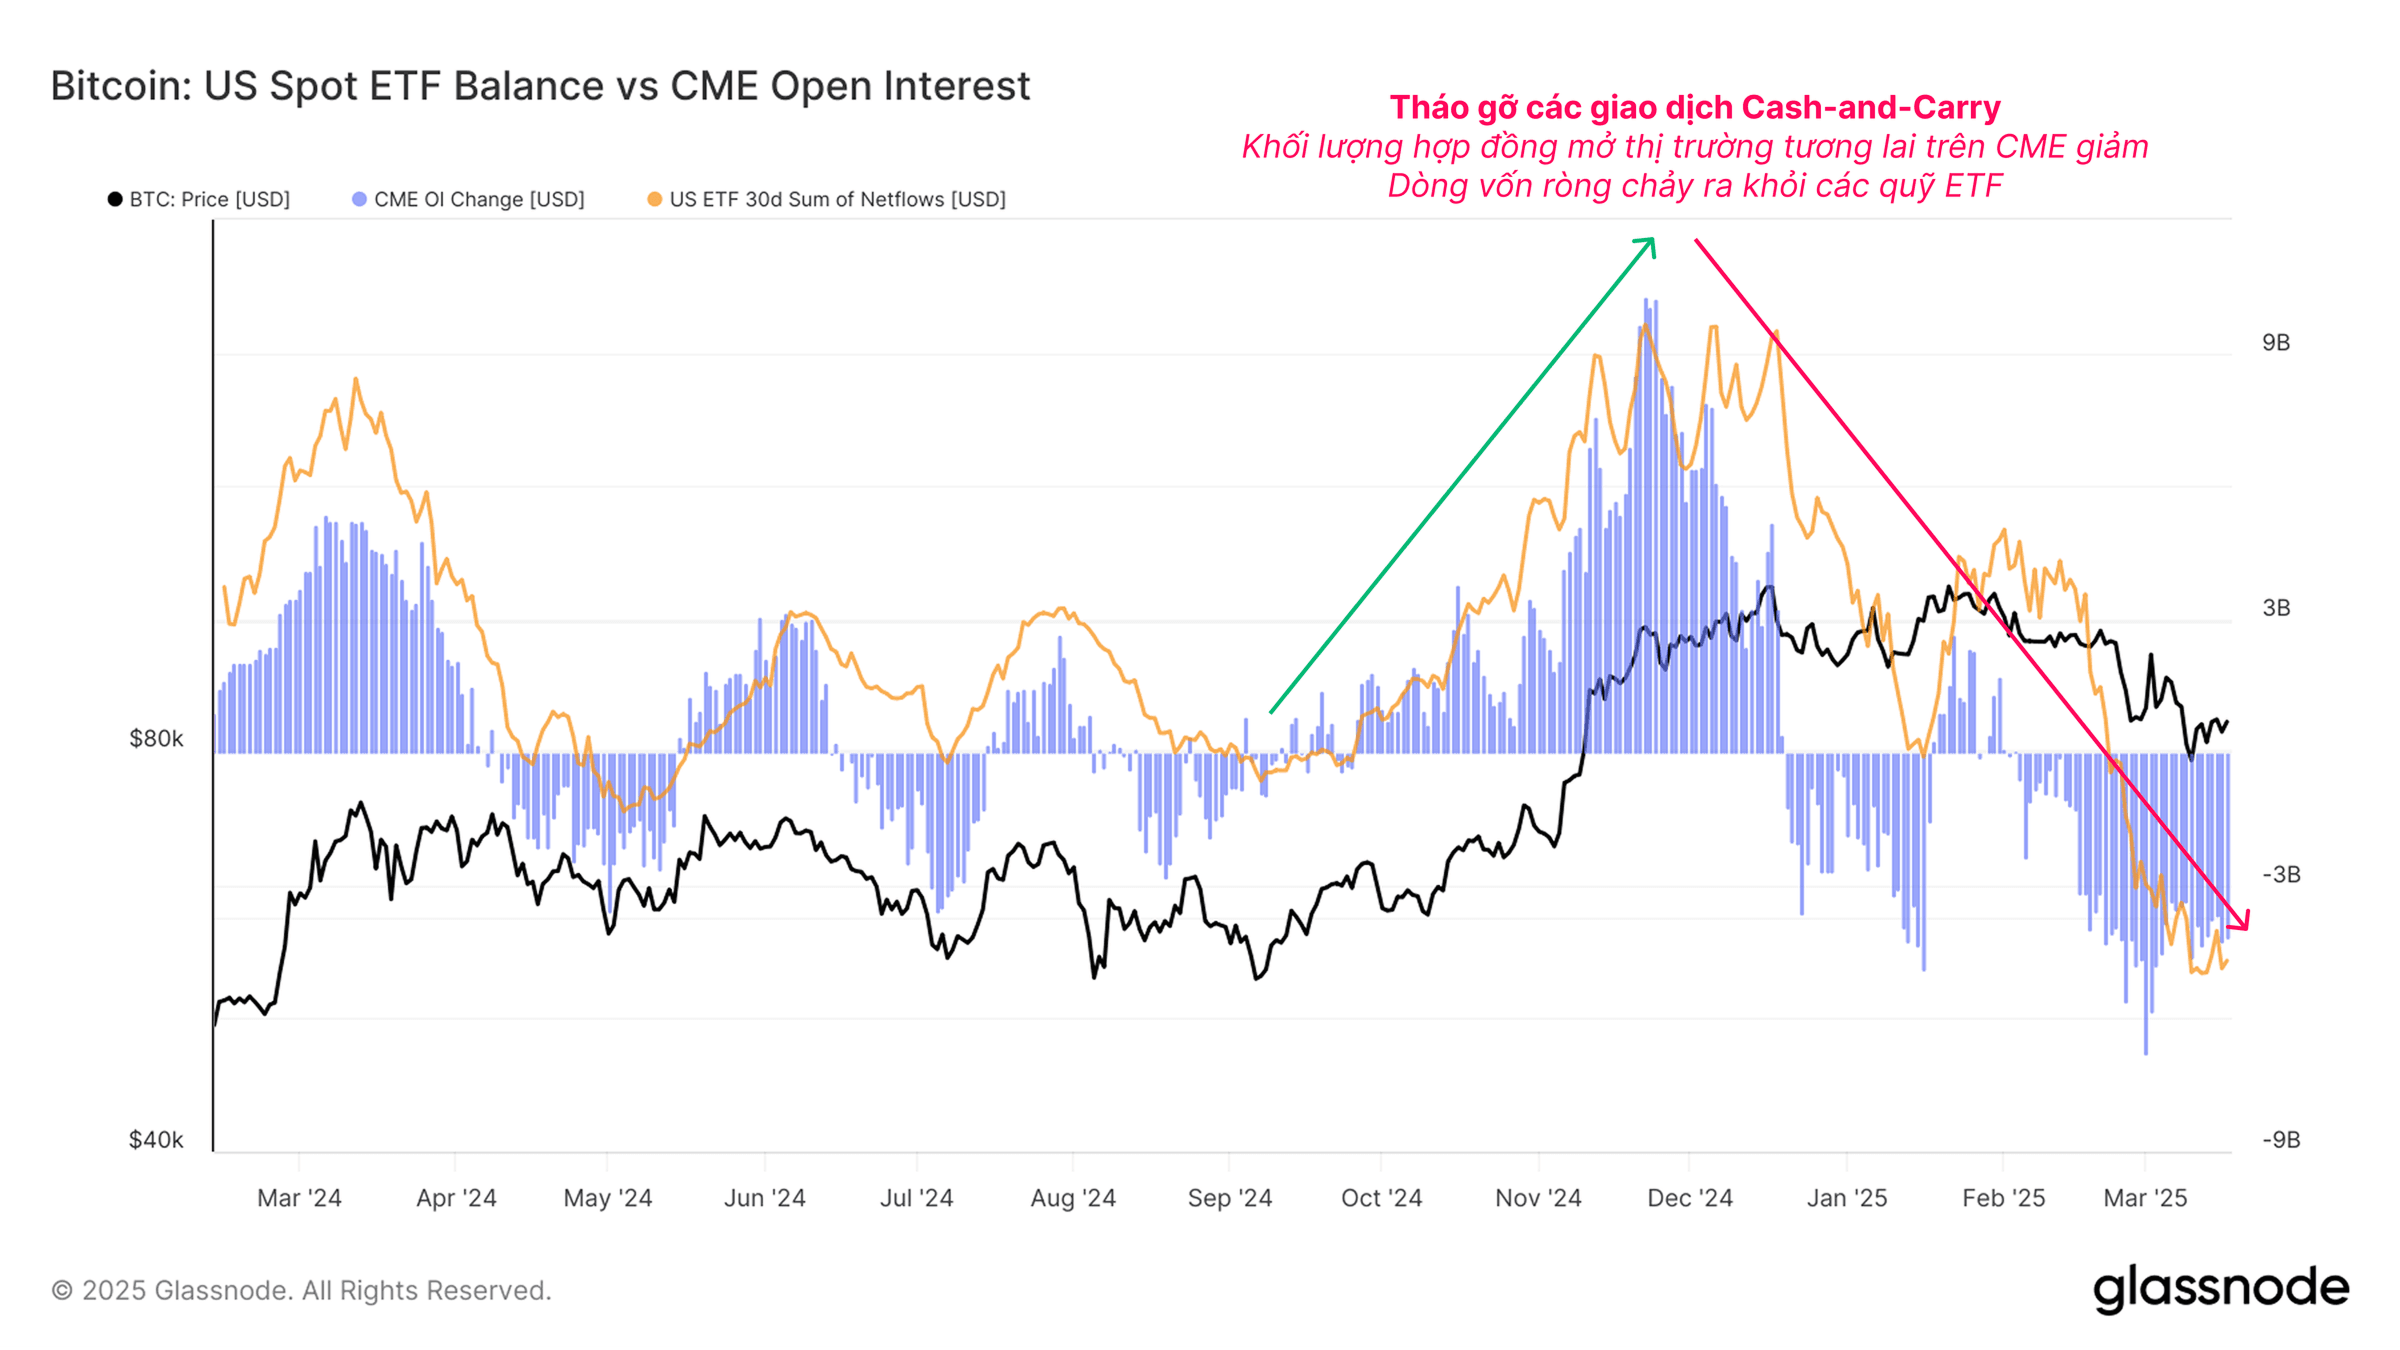
The introduction of US spot ETFs in 2024 provided institutional investors with the opportunity to put on regulated cash-and-carry trade positions. By pairing long-ETFs with a short-futures position via the CME Group exchange, traders can now arbitrage the oftentimes healthy price premium which exists between spot and futures markets.
Strong evidence for the cash-and-carry trade can be found by comparing the 30d flows into the US Spot ETFs and Open Interest across CME Futures contracts. Both of these metrics have experienced strong growth during the up-trending market between Oct and Dec 2024.
However, as long-side bias starts to soften in the market, an unwinding of the carry-trade appears to be underway. This has resulted in substantial ETF outflows, and the closure of a similar volume of futures positions.
Closing out these positions requires selling of the ETFs. Since the ETFs tend to trade with lighter volume than the futures markets, this can create additional headwinds for spot Bitcoin markets, whilst the futures markets are often large enough to absorb the additional volume.
Demand for Downside Protection
As Bitcoin and the digital asset landscape continues to mature and institutionalize, the size of options markets continues to grow. This is largely due to the versatility of the instrument, allowing investors to deploy sophisticated strategies, and fine tune their risk management strategies.
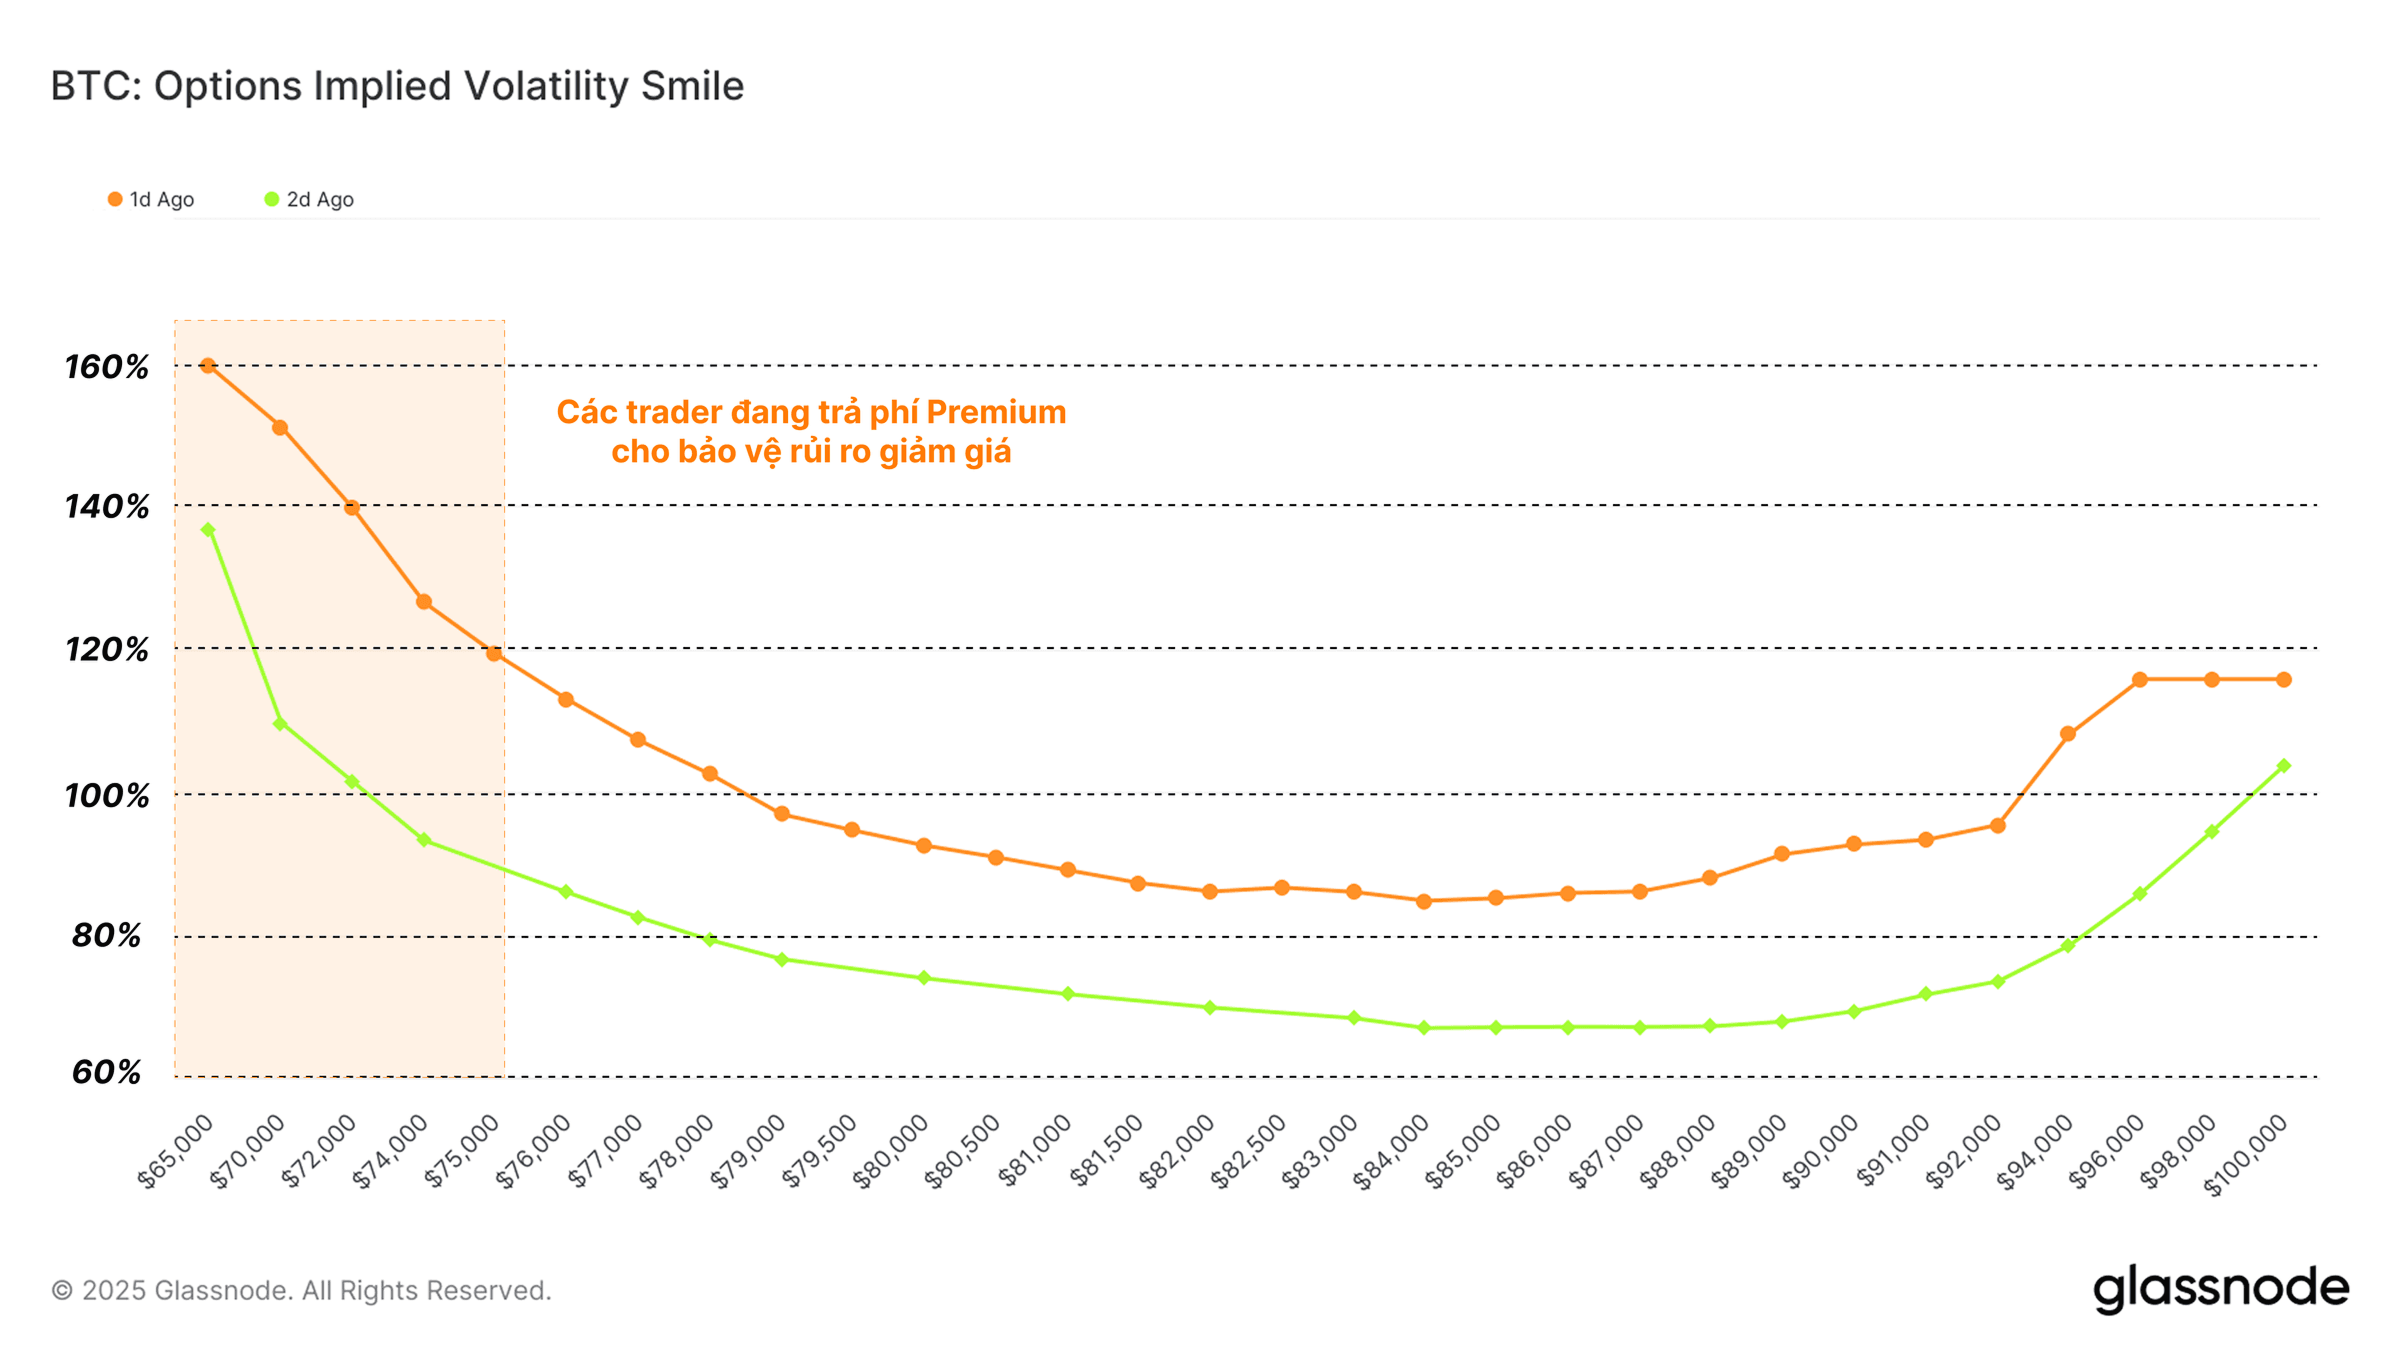
One metric we can use to gauge institutional investor sentiment and risk appetite is the Volatility Smile, showing the implied volatility premium paid for different puts or calls at various strike prices.
Currently, we can observe a higher premium exists for puts, suggesting that downside protection is comparatively more expensive. This reflects a prevailing market sentiment where downside protection carries a premium.
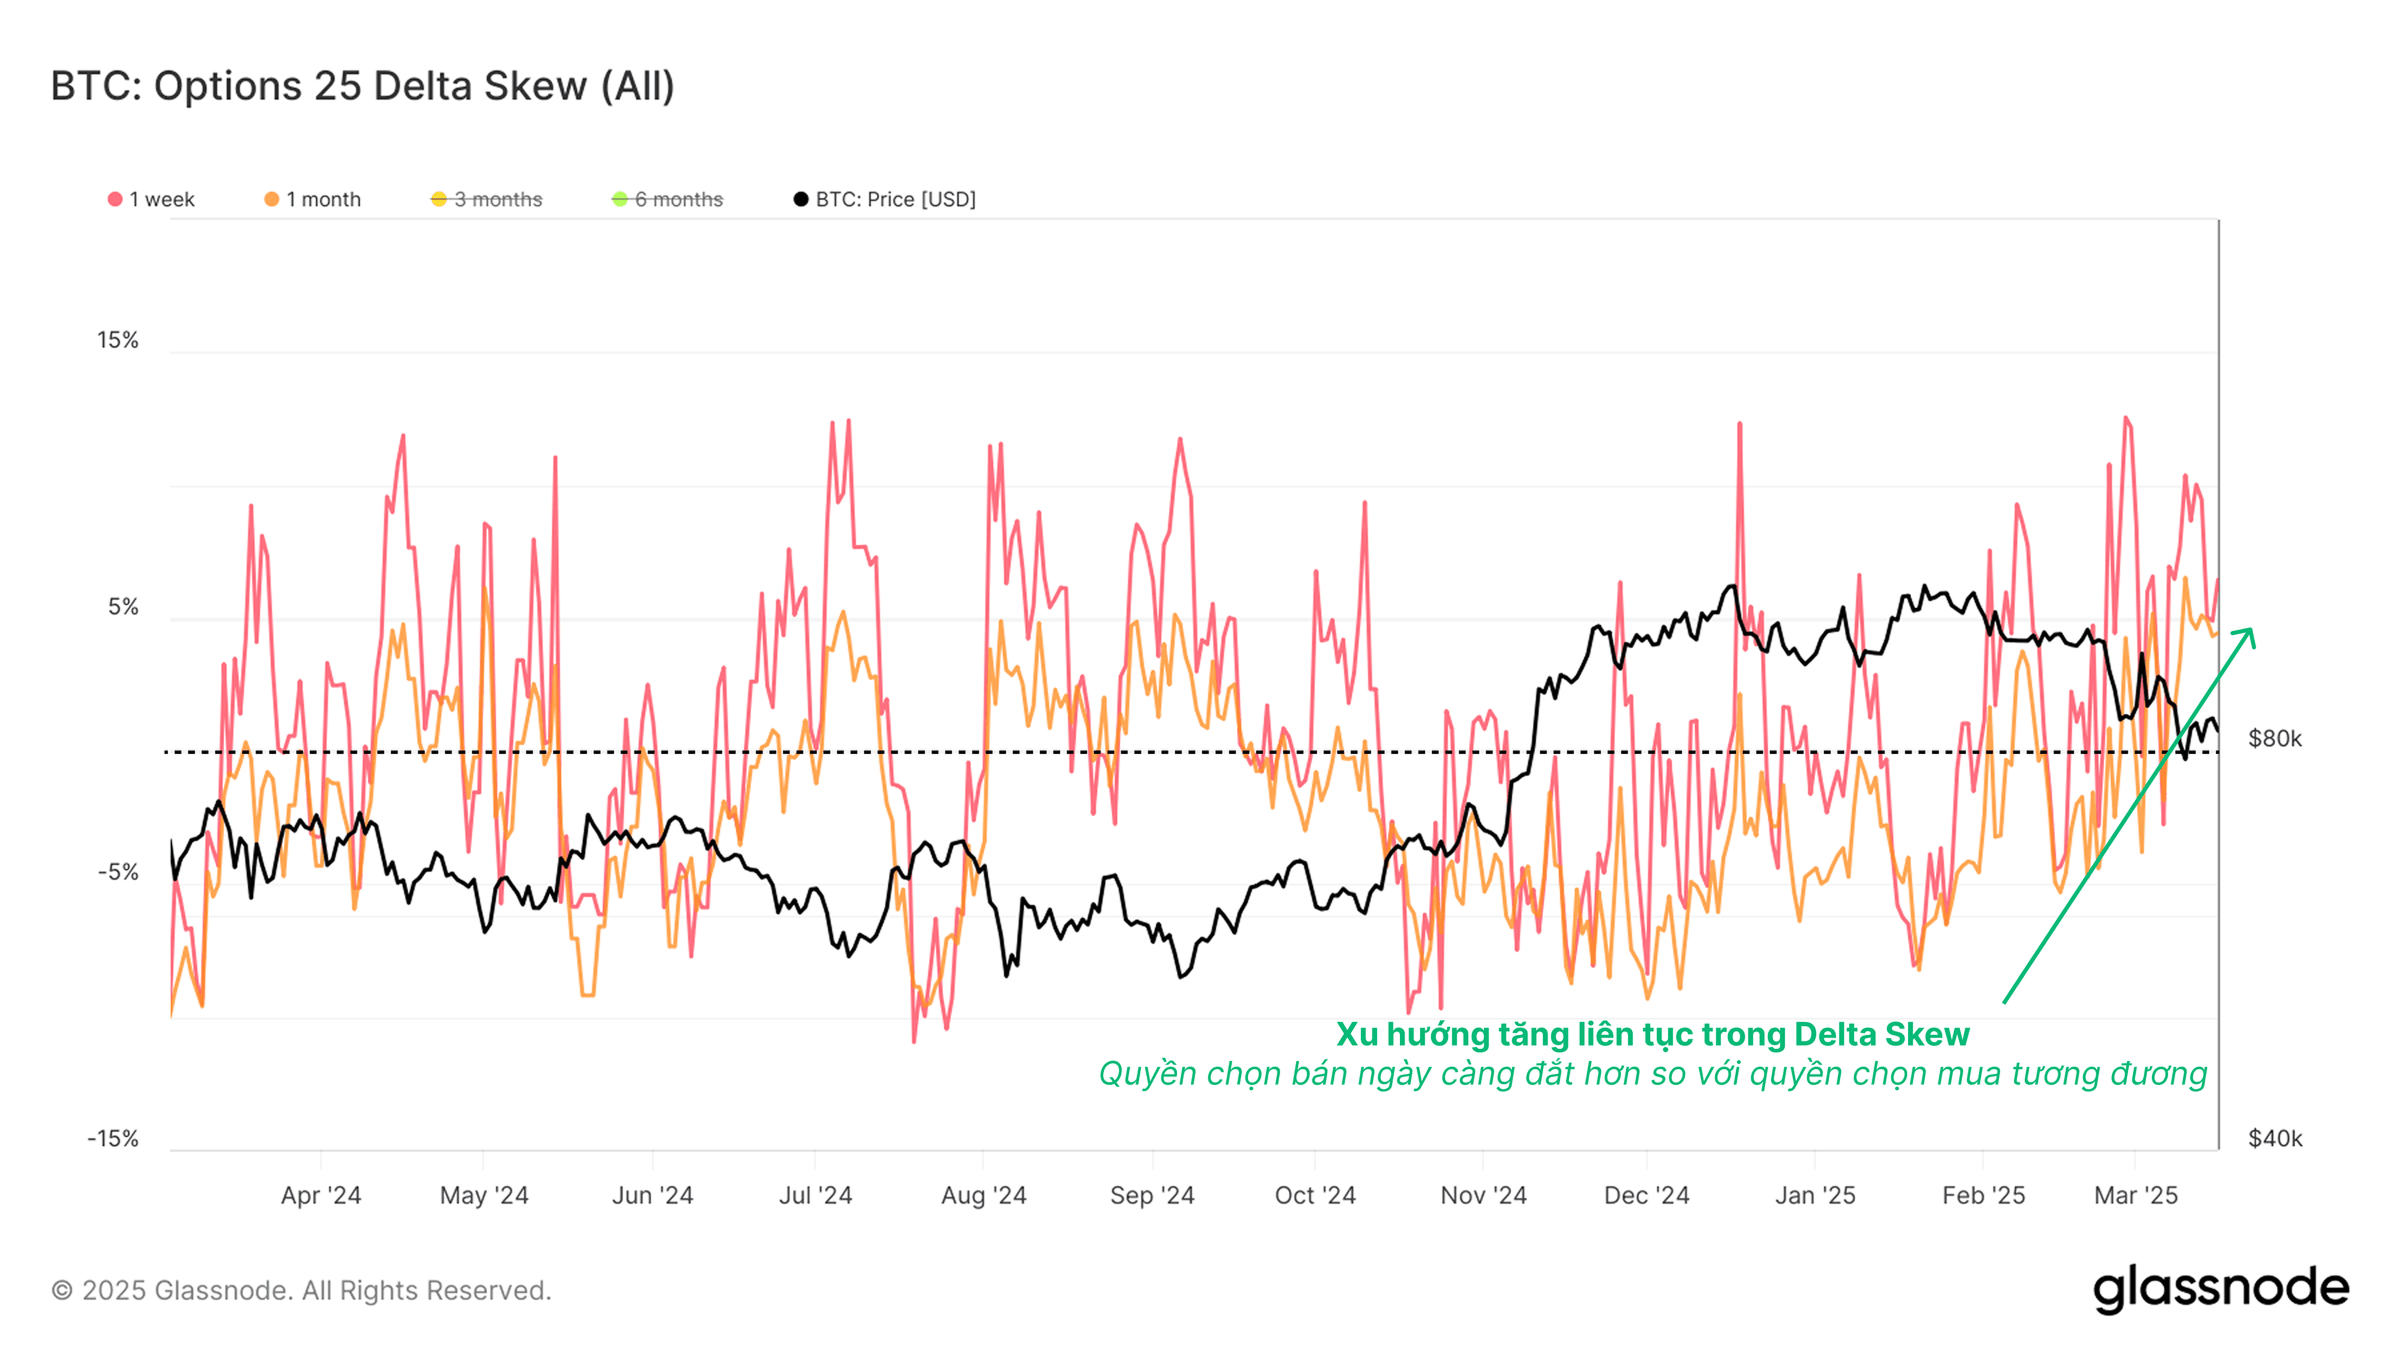
We can also see this within the Options 25 Delta Skew metric, which evaluates the difference in implied volatility for puts and calls with the same delta.
We can see a sustained uptrend in delta skew for the 1-week and 1-month contracts, suggesting that puts are increasingly more expensive than equivalent calls. This again underscores risk-averse behavior, and a heightened demand for downside protection.
Short-Term Holders Under Pressure
We have established that a broad contraction in liquidity is occurring across both the on-chain, and in derivative markets. In the next section, we will assess how this has affected Short and Long-Term Holder cohorts in the on-chain space.
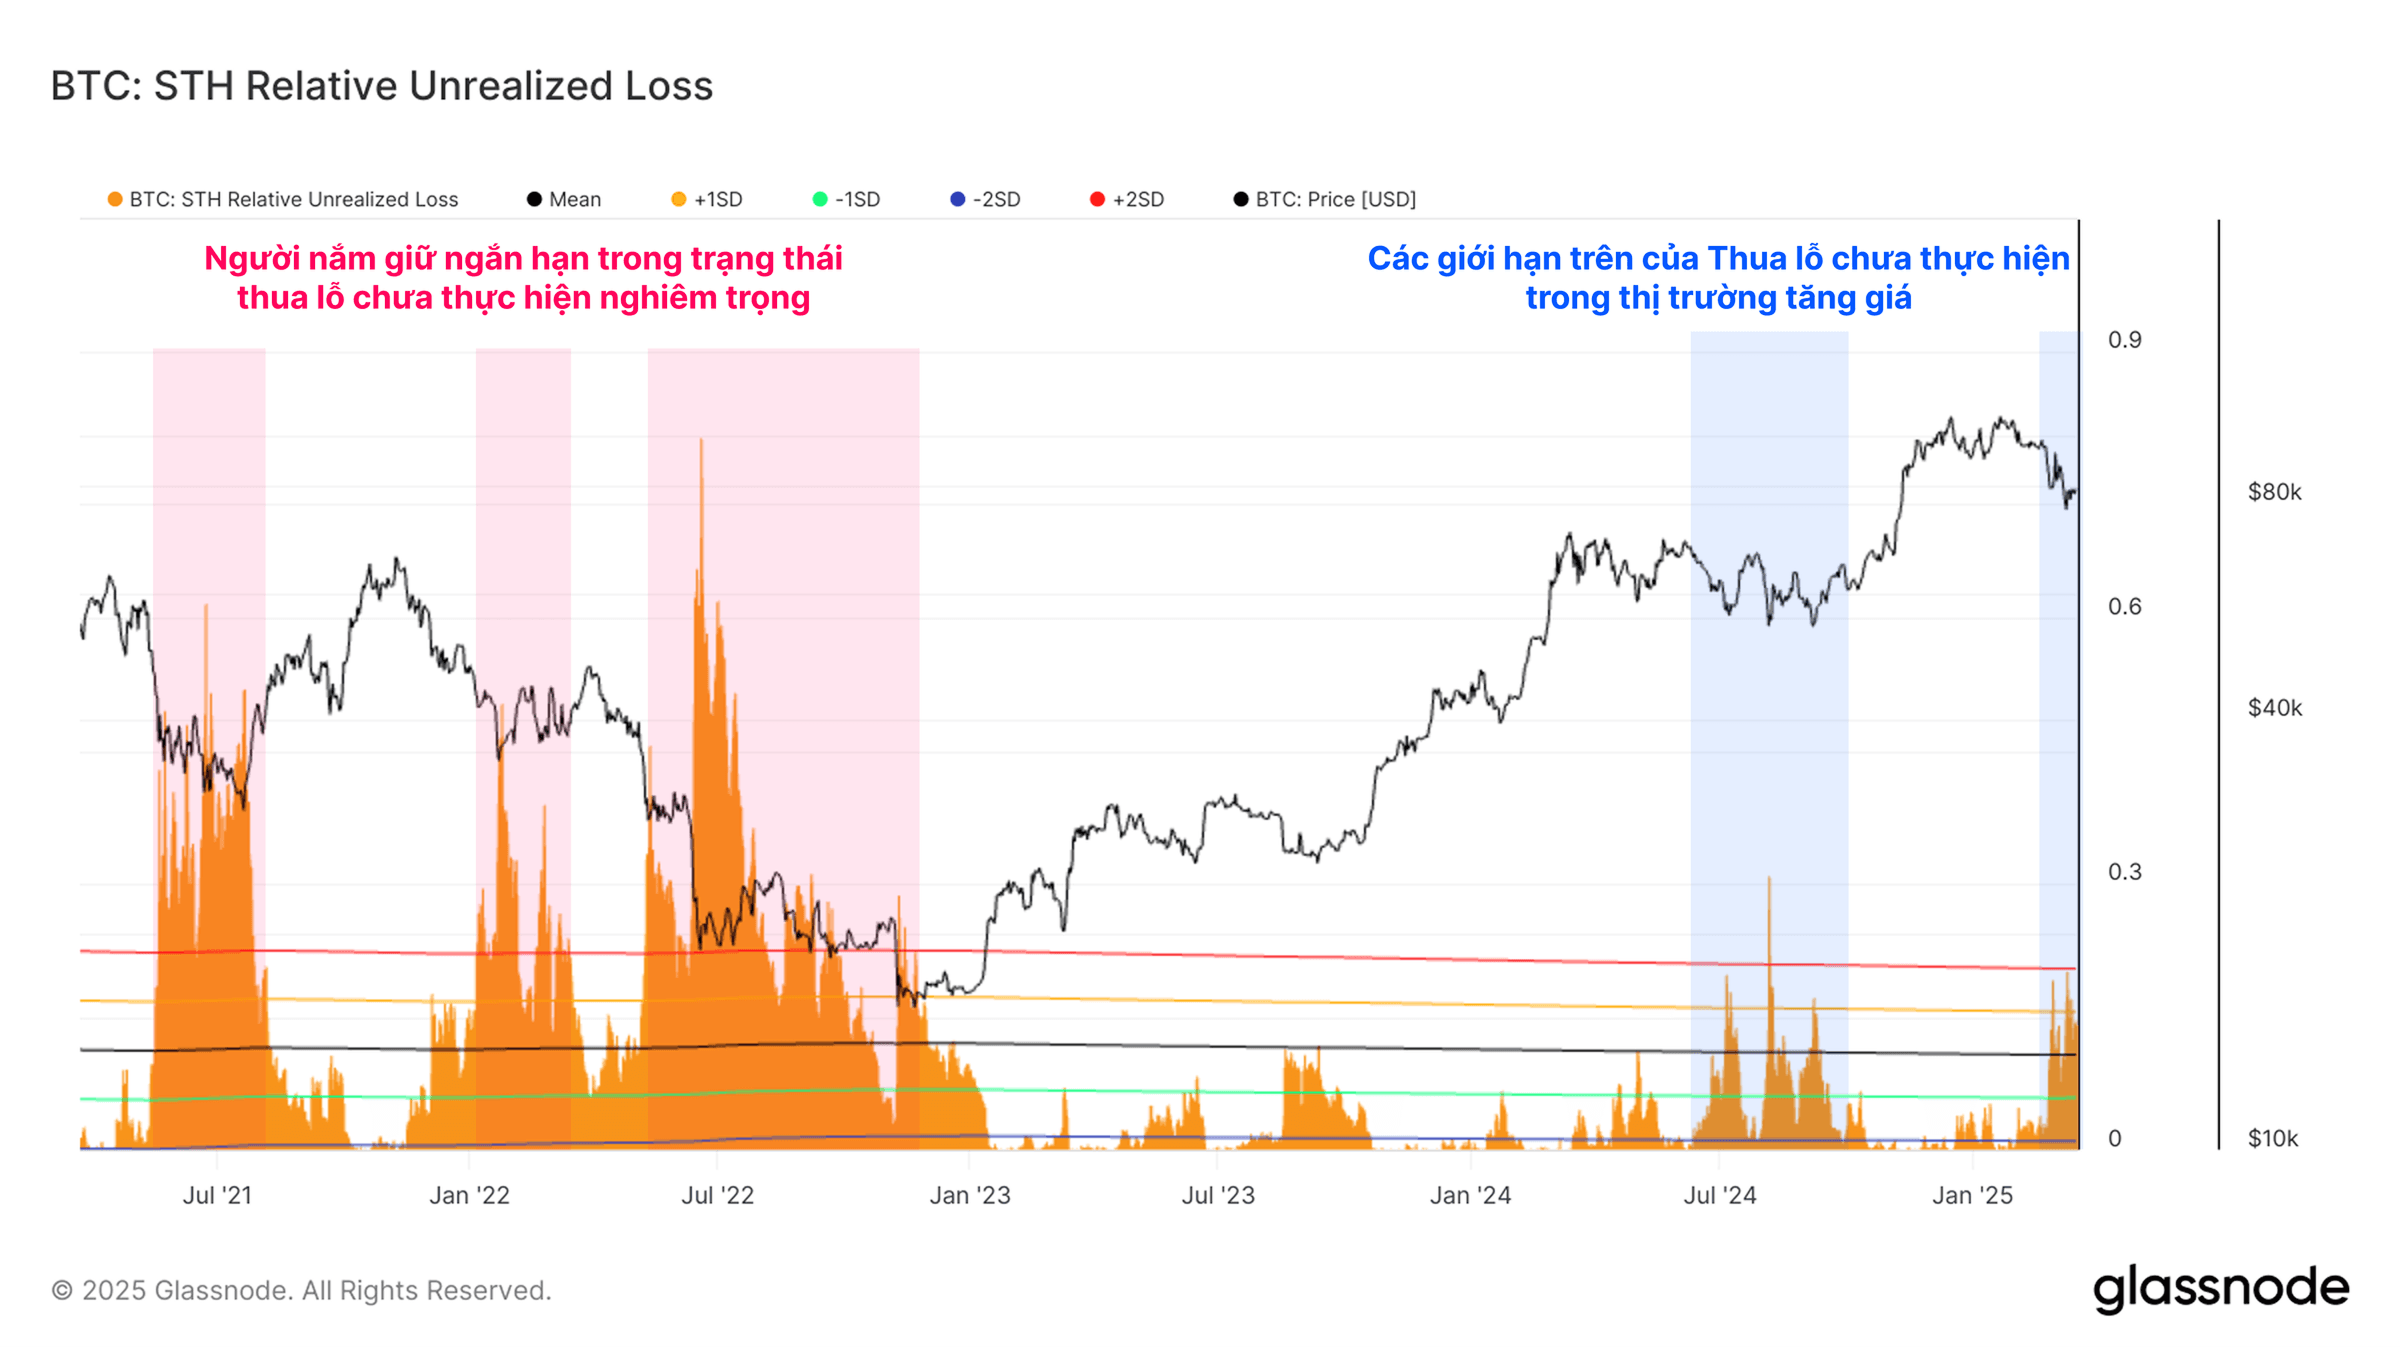
A commonly used tool for assessing investor stress is the unrealized loss metric, which reflects the dollar value of paper losses held by investors. The recent downtrend has plunged a substantial number of Short-Term Holder coins into an underwater position, with their relative unrealized loss nearly reaching the +2σ threshold.
Despite these elevated paper losses, the financial damage carried by new investors remains largely in line with the yen-carry-trade unwind on 5-Aug-2024. It is also aligned with the upper-bound values we have seen in most prior bull markets.
The scale of unrealized losses is also considerably less severe than those experienced during the May 2021 sell-off, and in the 2022 bear market.
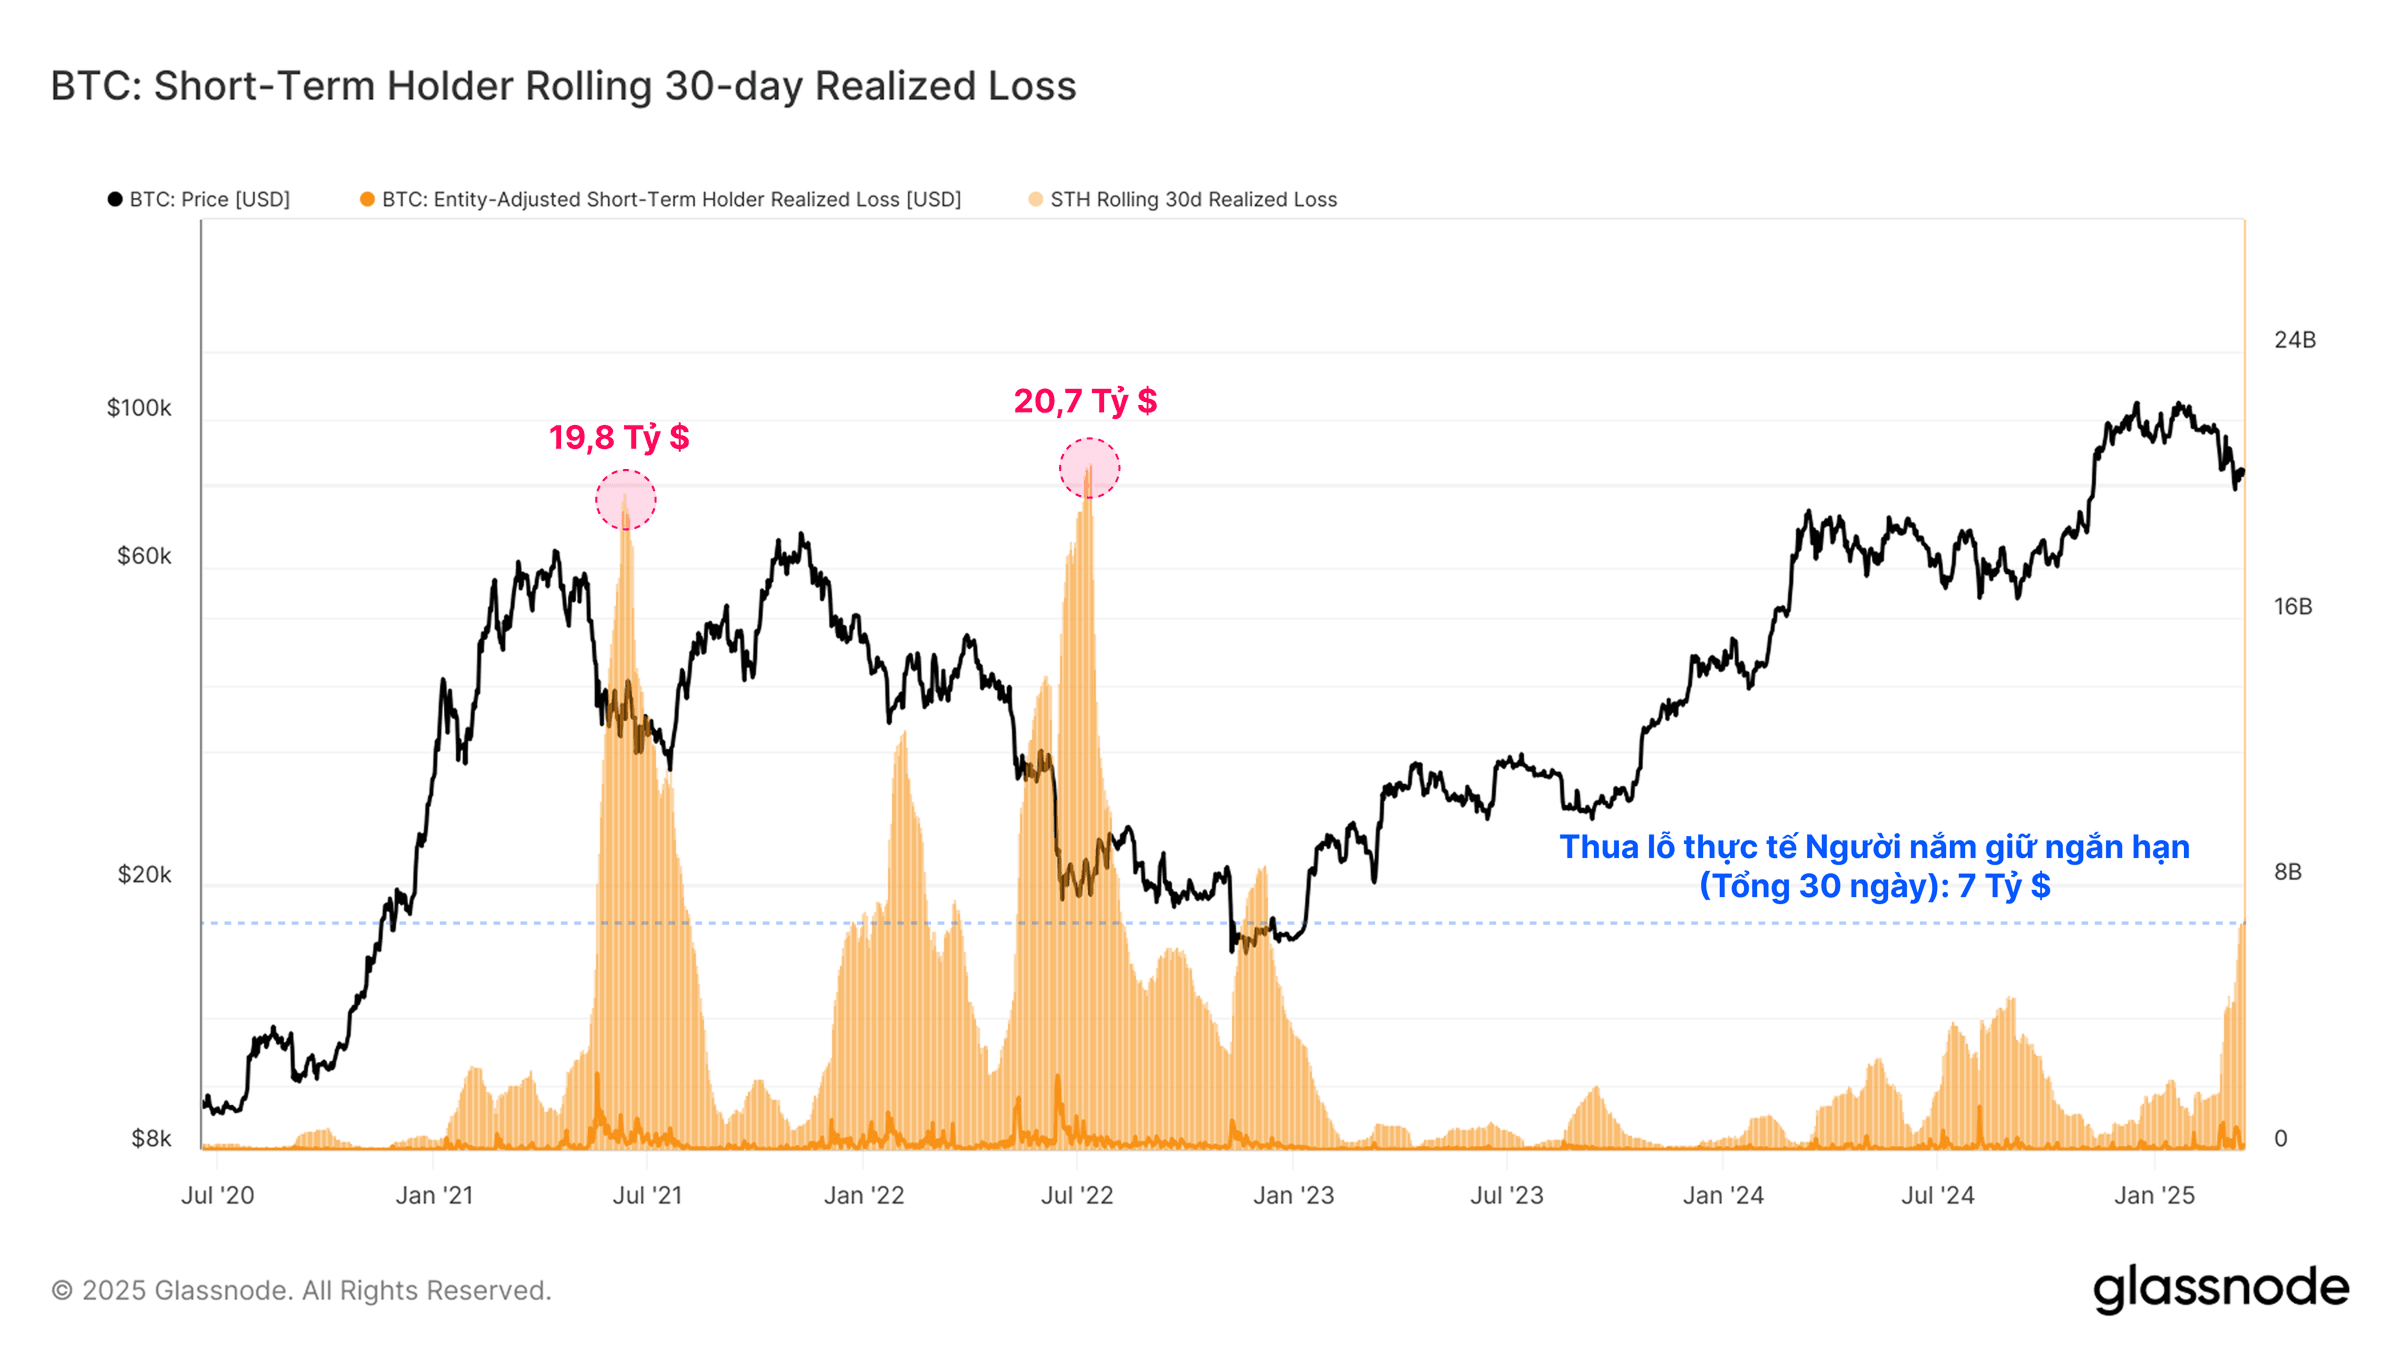
When evaluating the rolling 30-day sum of Short-Term Holder losses, we note that a large portion of new investors has capitulated under the immense drawdown pressure, with the current sell-off representing the largest sustained loss-taking event of the cycle ($7B).
Note again however, that the magnitude of losses is still far smaller than the previously mentioned capitulation events.
Long-Term Holders Remain Calm
Switching our focus towards the Long-Term Holder cohort, we note that their spending pressure is beginning to wane. One way we can quantify this is by using the Binary Spending Indicator, which is designed to spot when Long-term Holders are spending a significant proportion of their holdings in a sustained manner.
We note that the Binary Spending Indicator has begun to slow down, and pull back. Long-Term Holder supply is also beginning to climb after several months of decline.
This suggests that there is a greater willingness to hold, than to spend coins amongst this cohort. This perhaps represents a shift in sentiment, with Long-Term Holder behavior moving away from sell-side distribution.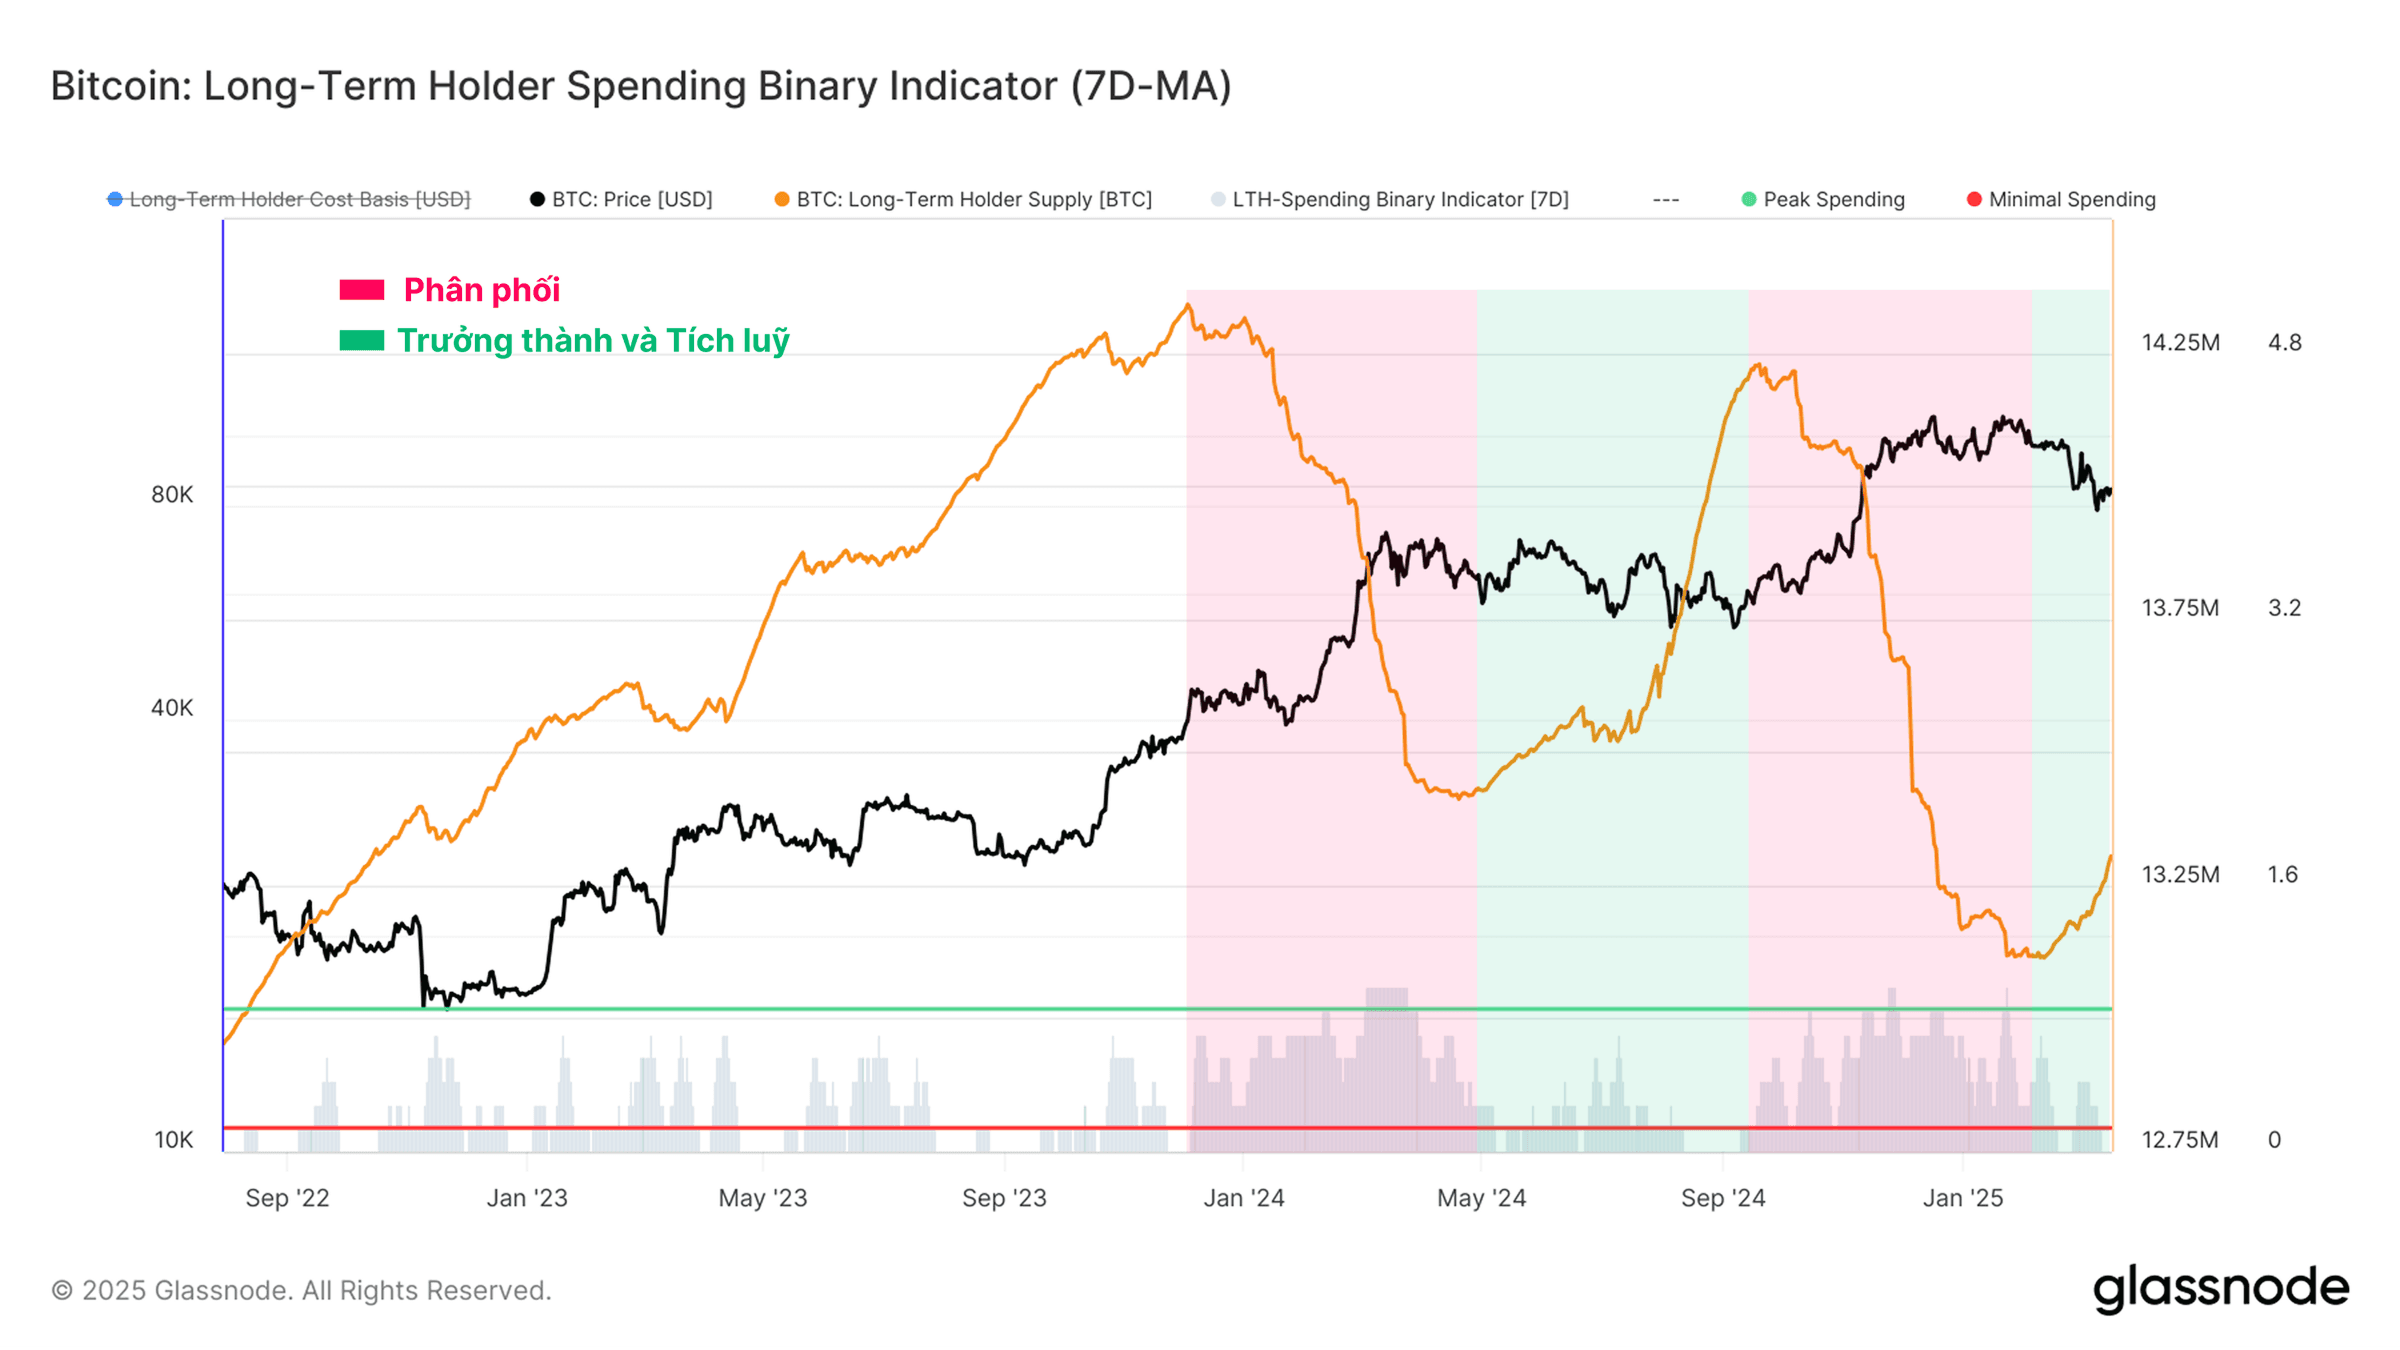
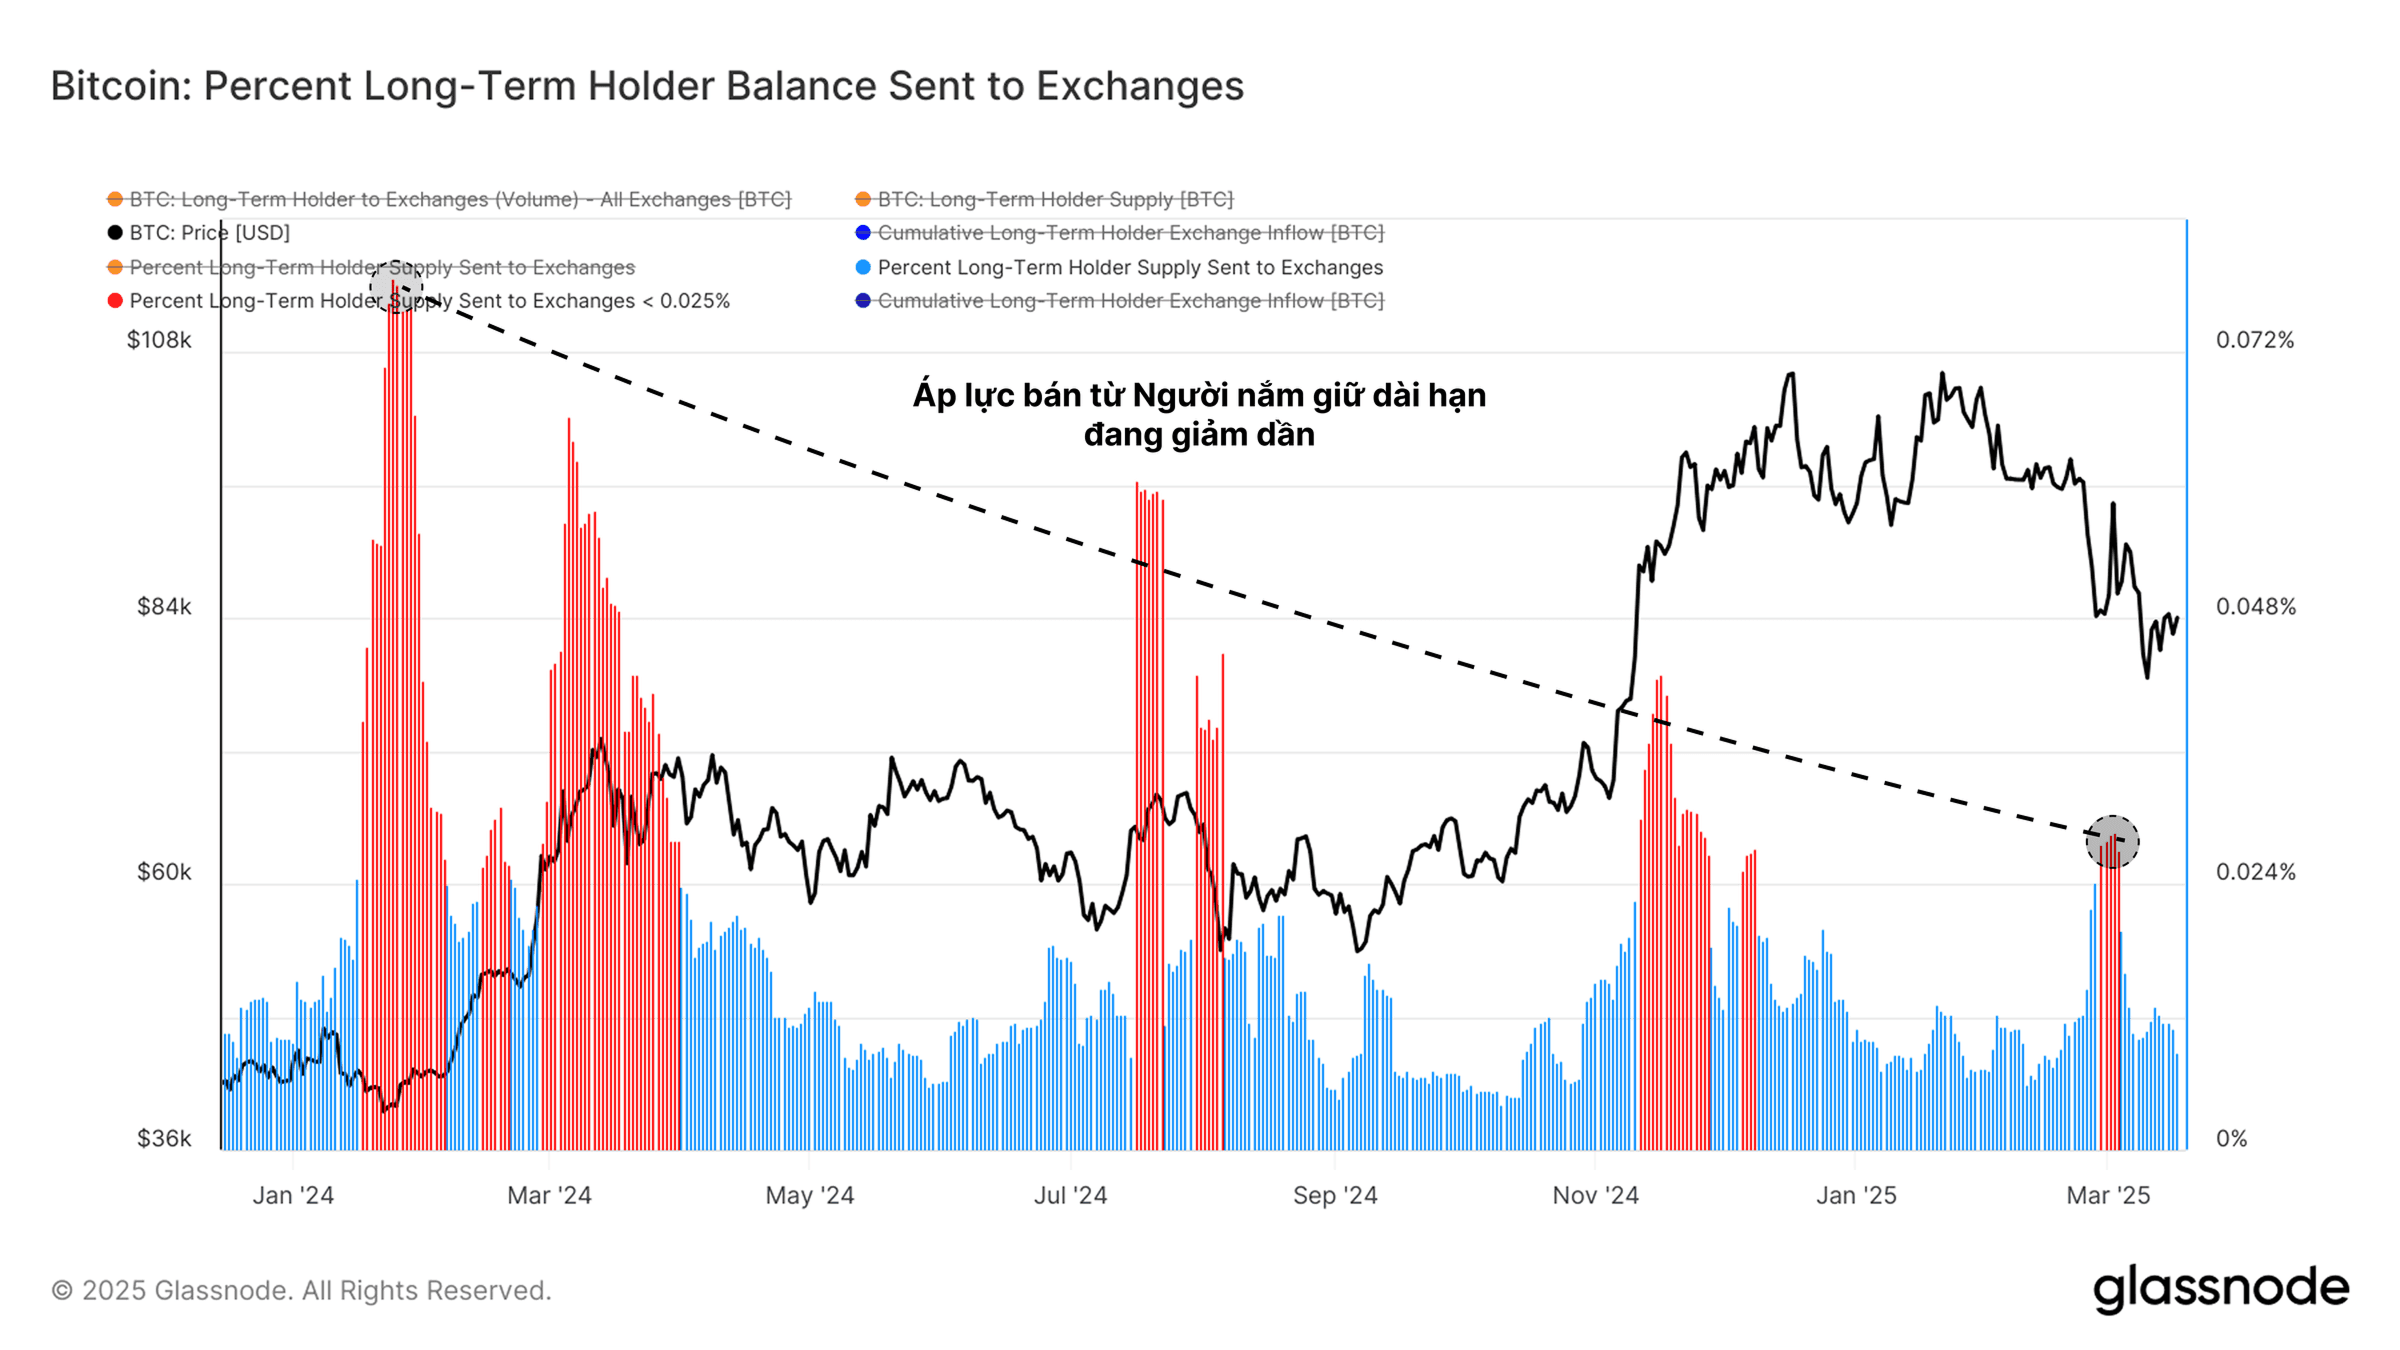
We can evaluate the percentage of the total Long-Term Holder balance sent to exchange addresses. By this metric, we can see a pronounced, but swift spike in distribution as the market traded down into the low-$80k range. This suggests that some long-term investors opted to de-risk, taking profits off the table amidst the uptick in volatility.
However, the intensity and magnitude of each distribution wave appears to be getting smaller. This perhaps alludes to a degree of saturation being reached amongst Long-Term Holders, where they have completed a majority of their sell-side activity within the current price range.
Bull markets are typically punctuated by intense sell-side pressure and profit taking from long-term investors, which is balanced by buy-side demand from new market participants.
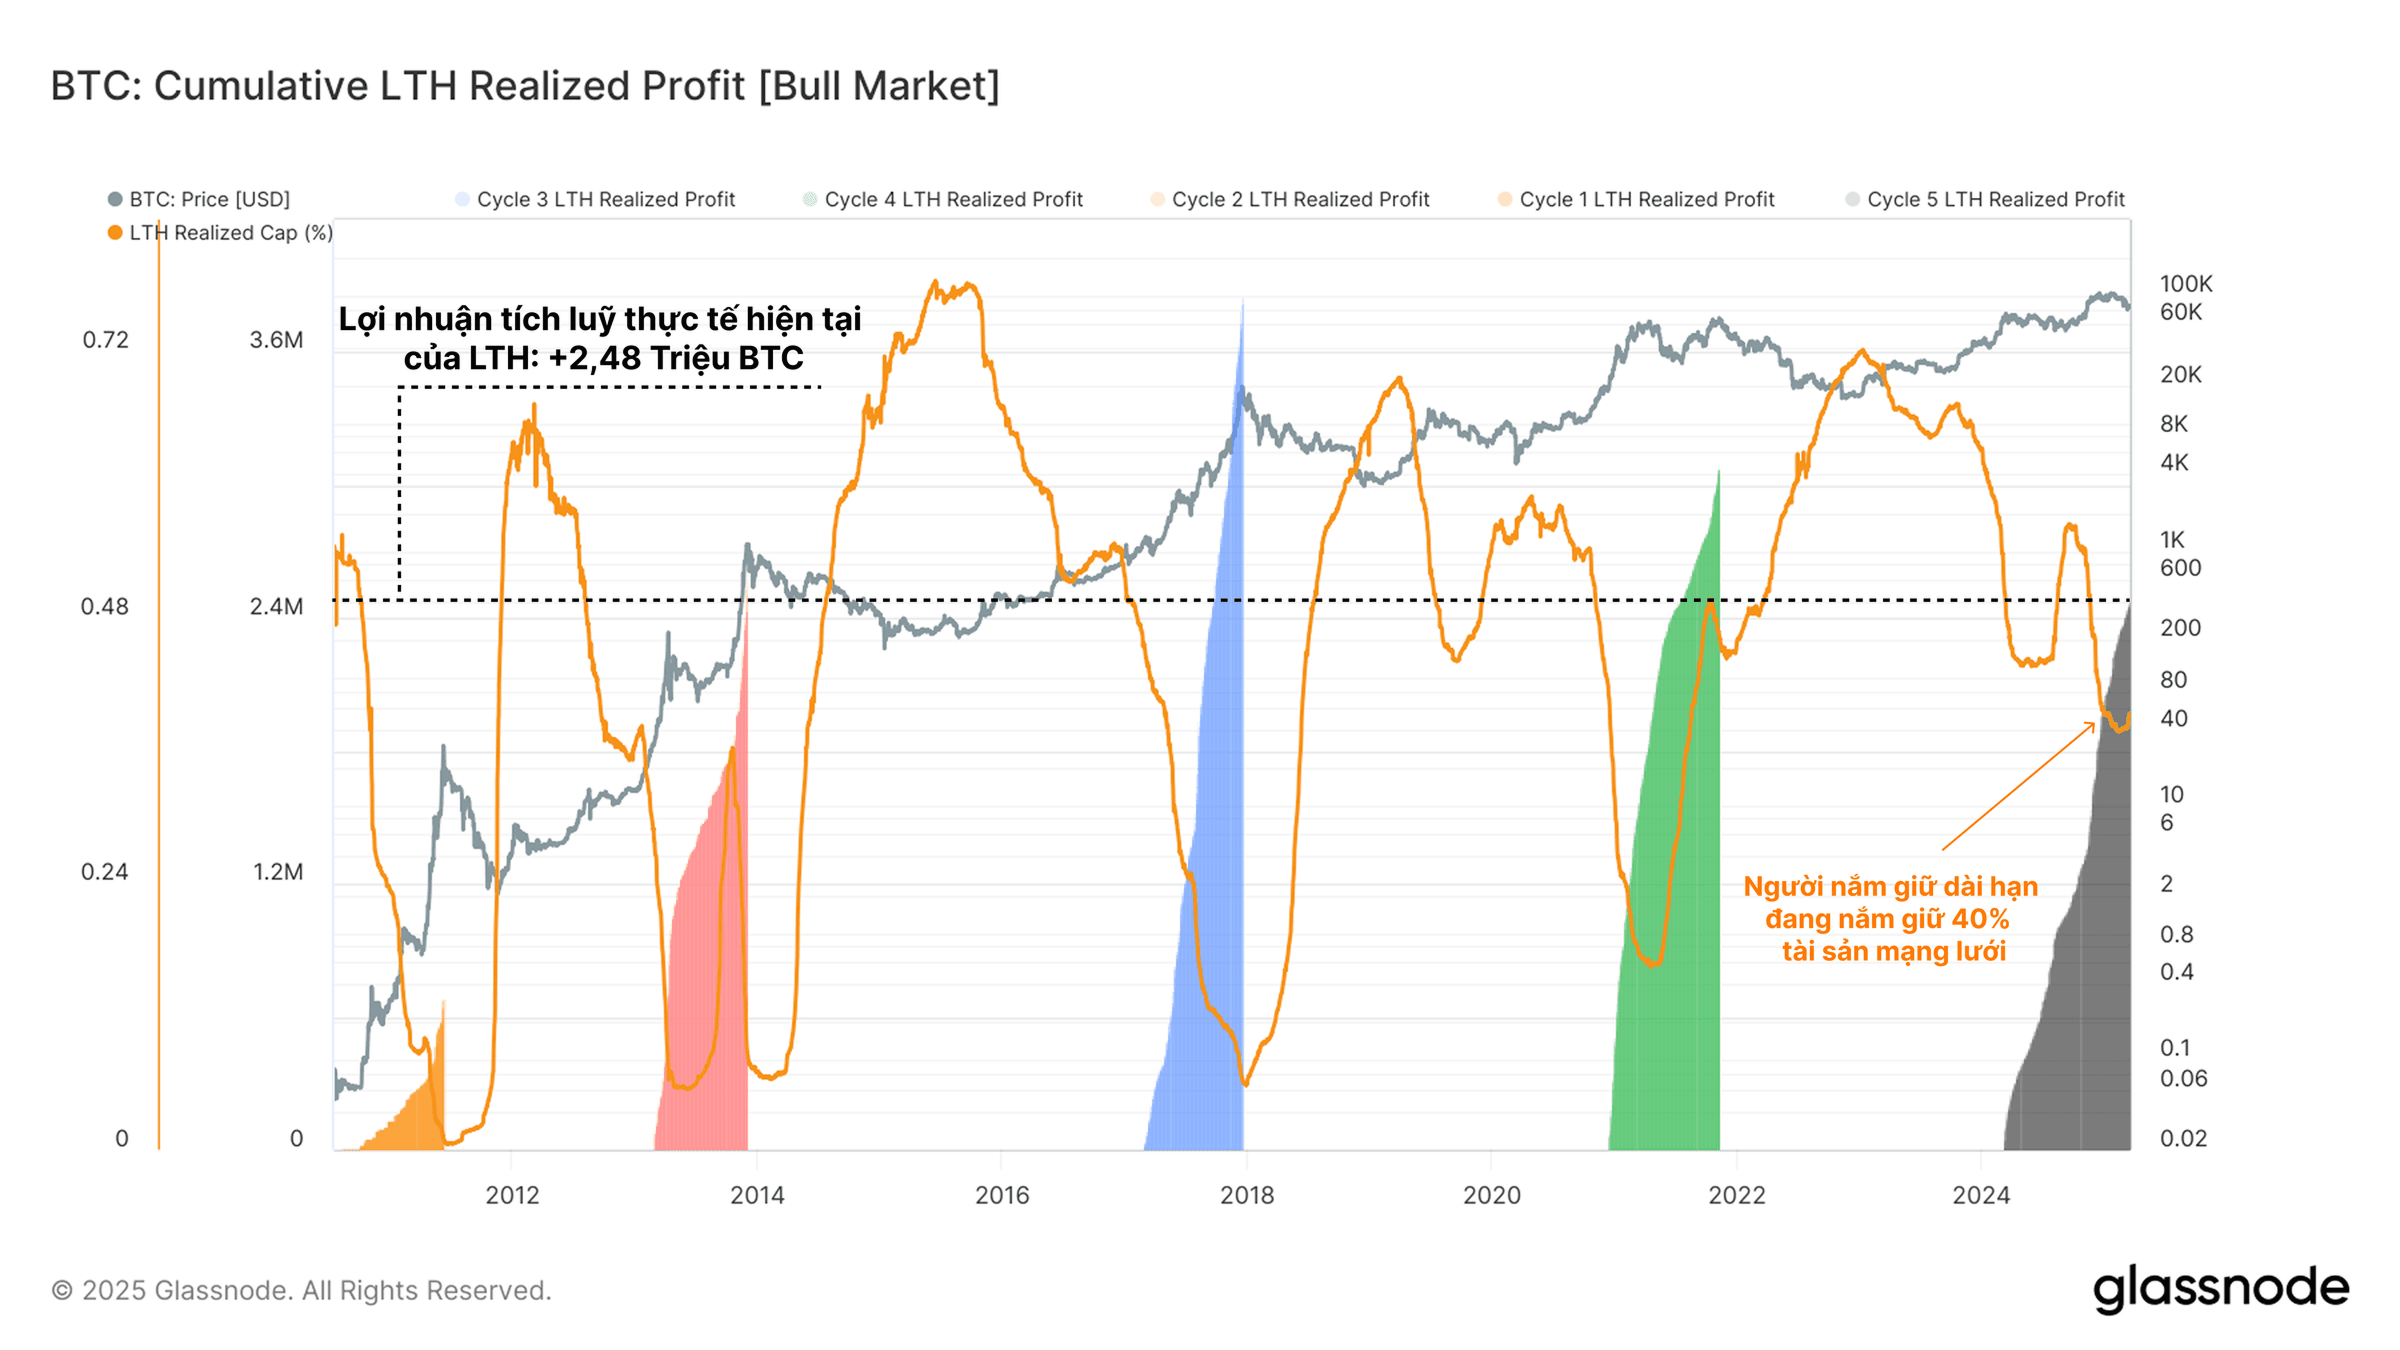
The metric below assesses the cumulative profit realized by Long-Term Holders since the previous cycle ATH was broken. We can then quantify the sell-side pressure that each cycle has absorbed, providing a proxy for the demand-side which was required to absorb it and sustain the bull market.
Interestingly, the amount of profit realized by LTHs this cycle is within a similar range to previous cycles, evidencing the significant volume of sell-side pressure that the market has absorbed.
However, it is also worth noting that the LTH the cohort still holds a comparatively large amount of the total wealth, especially for this later-stage of the cycle. This interesting observation may indicate a more unique market dynamic moving forwards, as a relatively large pool of capital remains tightly held.
Conclusions
A decline in speculation activity across digital assets is now apparent, with investors taking an increasingly risk-adverse stance. This is evidenced by the contraction in liquidity occurring across both on-chain and futures markets. Additionally, the options market continues to price a higher premium for downside protection.
When we look at the investor response to volatility, we see two divergent stories. First, Short-Term Holders are taking some of the largest losses of the cycle, reflecting a degree of fear. Long-Term Holders on the other hand, have slowed their spending, seeming to move away from sell-side distribution, and perhaps back towards patient accumulation and holding.
This is not investment advice.
Source.
#COINMAP
—————

Related posts


Latest
Subscribe
Subscribe with your email to receive information and promotions from 8xTrading